
 Nasdaq
 華爾街日報
華爾街日報Is It Too Late To Consider Markel Group After Its Strong 2025 Share Price Rally?
- Wondering if Markel Group at around $2,125 a share is still a smart buy, or if most of the upside has already been priced in? You are not alone; this stock has quietly become a favorite among long term compounders.
- The share price is up around 4% over the last week, 3.1% over the last month, and an impressive 23.8% year to date, adding to 22.0% over 1 year, 66.1% over 3 years, and 110.3% over 5 years.
- Those gains sit against a backdrop of Markel steadily expanding its specialty insurance footprint and continuing to grow its diverse portfolio of operating businesses, which investors often compare to a smaller, more focused Berkshire style model. At the same time, the company has been active in capital allocation, from bolt on acquisitions to ongoing investment portfolio shifts, all of which shape how the market thinks about its long term value and risk.
- Despite that track record, Markel currently scores 0/6 on our valuation checks, as shown in our valuation scorecard, suggesting the market may already be pricing it as a quality franchise. Next, we will walk through different valuation approaches to see whether the numbers back that up, and then we will finish with a more holistic way of thinking about Markel's real worth.
Markel Group scores just 0/6 on our valuation checks. See what other red flags we found in the full valuation breakdown.
Approach 1: Markel Group Excess Returns Analysis
The Excess Returns model asks whether Markel Group creates value above the return that shareholders reasonably demand on their equity. It compares the company’s expected profitability on its equity base with the cost of that equity, then capitalizes the gap to estimate intrinsic value per share.
For Markel, analysts expect Stable EPS of $119.86 per share, based on forward looking Return on Equity forecasts from four analysts, against a Cost of Equity of $110.03 per share. That implies an Excess Return of $9.82 per share, supported by an Average Return on Equity of 7.58%. The model uses a current Book Value of $1,429.48 per share and a Stable Book Value assumption of $1,581.85 per share from three analysts to project how this value creation compounds over time.
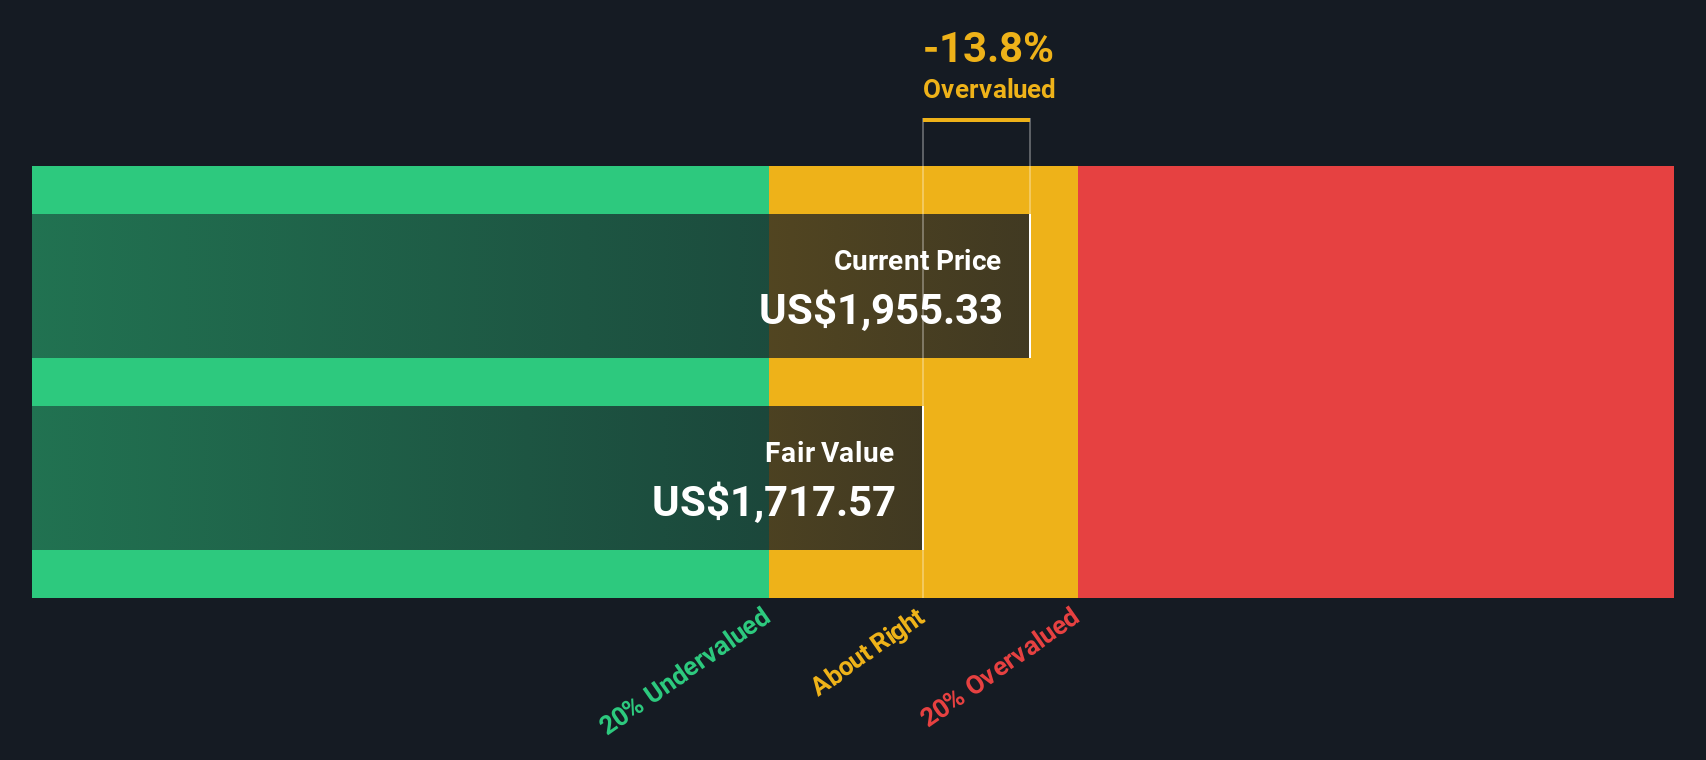
Using these inputs, the Excess Returns valuation arrives at an intrinsic value of about $1,847.60 per share. This suggests the stock is roughly 15.1% above fair value at the current price near $2,125. On this view, investors are paying a premium for quality that the model does not fully justify.
Result: OVERVALUED
Our Excess Returns analysis suggests Markel Group may be overvalued by 15.1%. Discover 908 undervalued stocks or create your own screener to find better value opportunities.
Approach 2: Markel Group Price vs Earnings
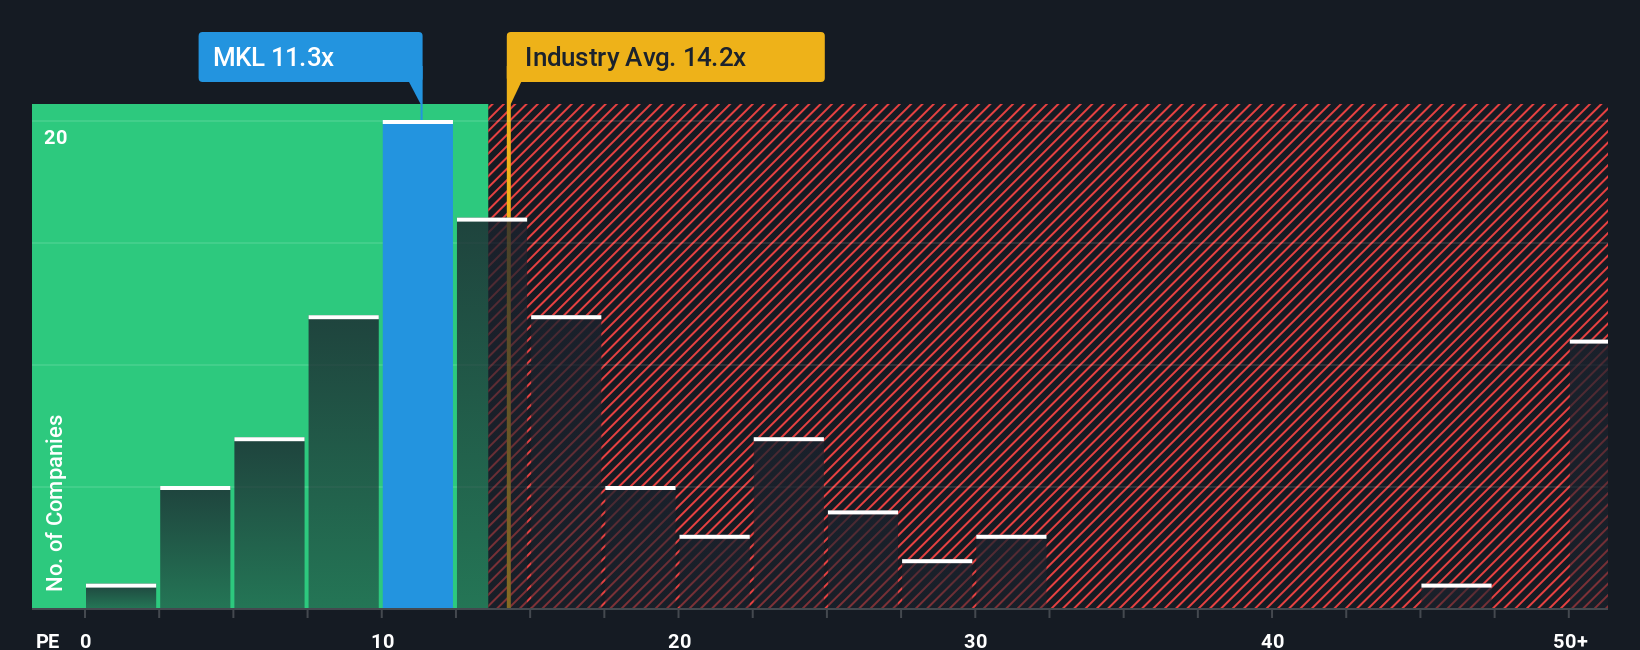
For a consistently profitable company like Markel, the Price to Earnings (PE) ratio is a useful way to gauge what investors are willing to pay for each dollar of current earnings. In general, faster growth and lower perceived risk justify a higher PE multiple, while slower growth or higher uncertainty usually warrant a discount.
Markel currently trades on a PE of about 14.79x. That sits slightly above the broader insurance industry average of roughly 13.11x and also above the peer group average of around 12.88x, suggesting the market assigns Markel a quality premium versus typical insurers. However, simple comparisons like this do not capture the full picture of its growth profile, margins and risk.
Simply Wall St’s Fair Ratio is designed to address that limitation by estimating the PE multiple that would be reasonable for Markel given its earnings growth outlook, profitability, industry, market cap and risk characteristics. For Markel, that Fair Ratio is 12.49x, below the current 14.79x, which points to the shares trading ahead of what those fundamentals alone would support.
Result: OVERVALUED
PE ratios tell one story, but what if the real opportunity lies elsewhere? Discover 1447 companies where insiders are betting big on explosive growth.
Upgrade Your Decision Making: Choose your Markel Group Narrative
Earlier we mentioned that there is an even better way to understand valuation. Let us introduce you to Narratives, a simple framework on Simply Wall St’s Community page that lets you describe your story about Markel Group in plain language. You can turn that story into assumptions about future revenue, earnings and margins, and then automatically link those assumptions to a fair value you can compare to today’s share price to decide whether to buy or sell. The Narrative updates dynamically as new earnings, news or filings arrive. For example, one investor might build a more bullish Markel Narrative around steady specialty insurance growth, expanding Markel Ventures cash flows and ongoing buybacks that supports a fair value near the higher community estimate of roughly $2,100 per share. Another might take a more cautious view focused on reserve risks, margin pressure and tougher competition that anchors their fair value closer to the lower end of community estimates. Both perspectives can sit side by side, transparently tied to the numbers behind them.
Do you think there's more to the story for Markel Group? Head over to our Community to see what others are saying!

This article by Simply Wall St is general in nature. We provide commentary based on historical data and analyst forecasts only using an unbiased methodology and our articles are not intended to be financial advice. It does not constitute a recommendation to buy or sell any stock, and does not take account of your objectives, or your financial situation. We aim to bring you long-term focused analysis driven by fundamental data. Note that our analysis may not factor in the latest price-sensitive company announcements or qualitative material. Simply Wall St has no position in any stocks mentioned.
Have feedback on this article? Concerned about the content? Get in touch with us directly. Alternatively, email editorial-team@simplywallst.com