
 Nasdaq
 華爾街日報
華爾街日報Is It Too Late To Consider Signet Jewelers After Its Five Year 265.3% Surge?
- If you are wondering whether Signet Jewelers is still a hidden gem or if most of the upside has already been priced in, this article will walk you through what the numbers are really saying about its value.
- The stock has been on a bit of a rollercoaster, up 9.0% over the last week and 18.7% year to date, even after a recent 10.2% pullback over the last month, building on an impressive 265.3% gain over five years.
- Behind those moves, investors have been reacting to Signet's strategic push into higher margin categories, ongoing store optimization, and its continued investment in digital channels that blur the line between online and in store jewelry buying. Alongside that, the company has been leaning into shareholder returns via buybacks and dividends, signaling confidence in its longer term trajectory.
- On our framework, Signet scores a 3/6 valuation score, suggesting it screens as undervalued on half of our checks, but not extremely cheap on all metrics. Next, we will unpack how different valuation approaches view the stock, and then circle back to a more holistic way of thinking about Signet's true worth that can be even more useful than any single model.
Approach 1: Signet Jewelers Discounted Cash Flow (DCF) Analysis
A Discounted Cash Flow, or DCF, model estimates what a business is worth by projecting the cash it can generate in the future and then discounting those cash flows back to today in dollar terms.
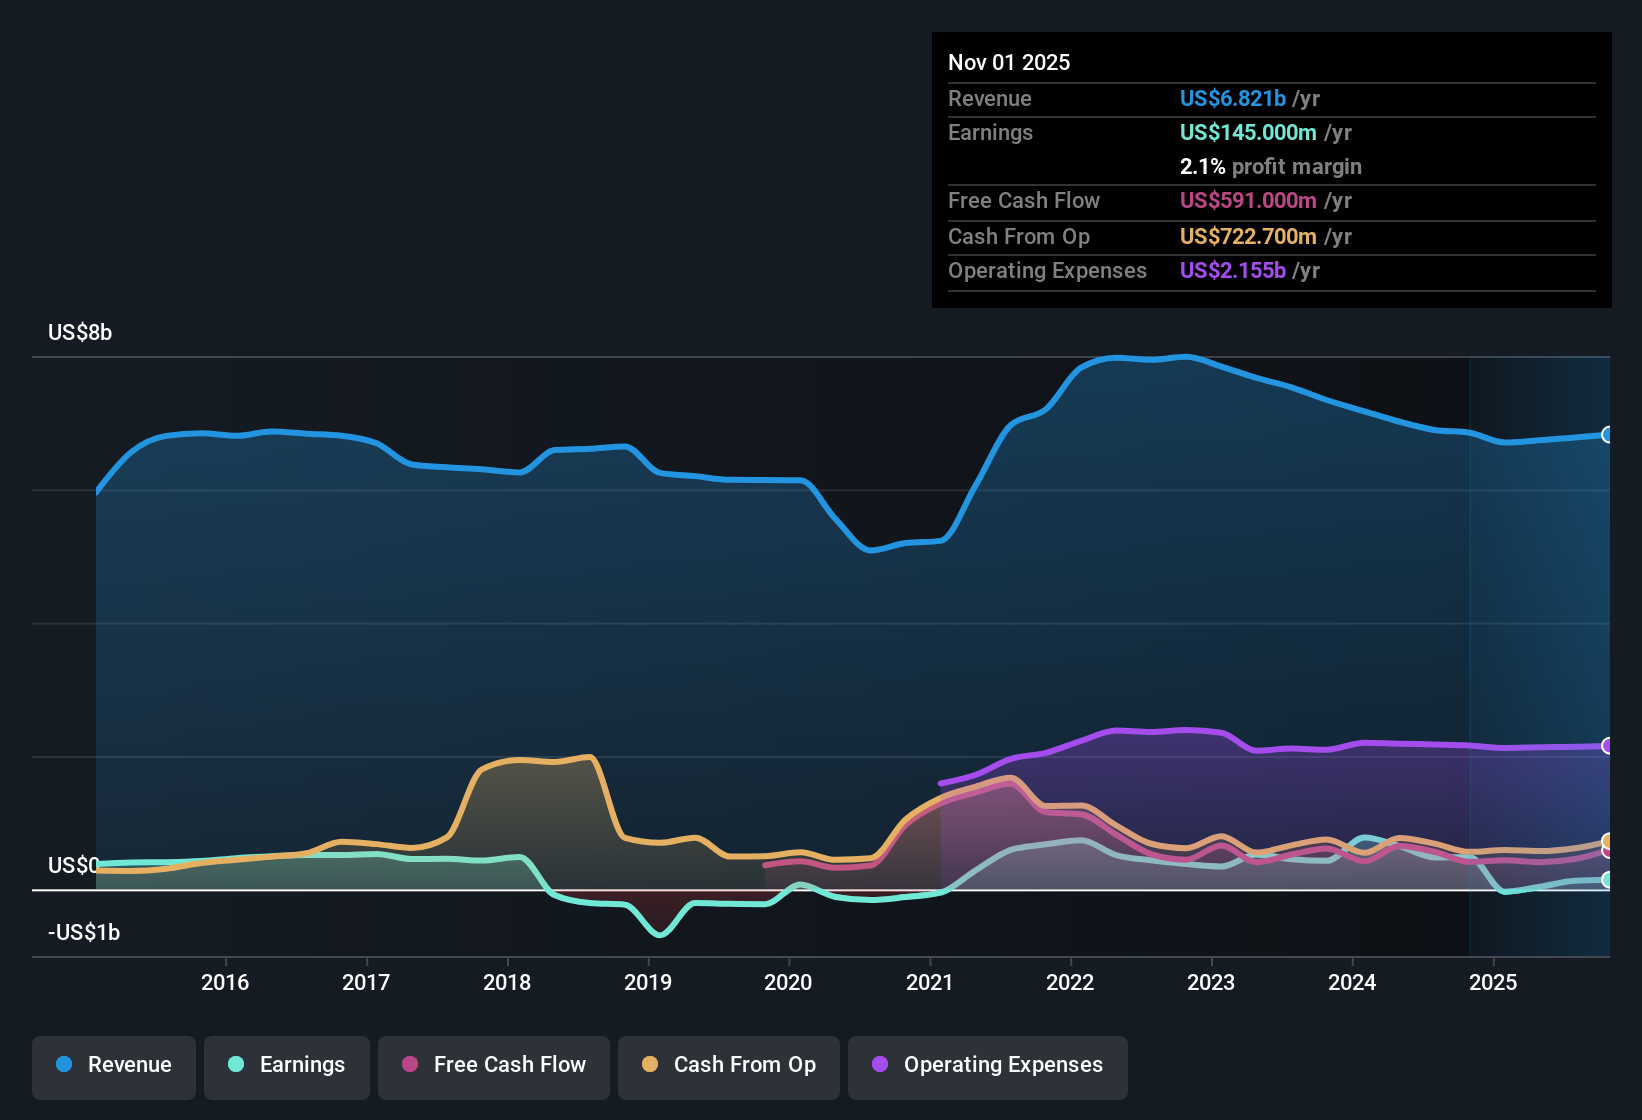
For Signet Jewelers, the model starts with last twelve month free cash flow of about $587.7 million and uses a 2 stage Free Cash Flow to Equity approach. Analysts provide explicit forecasts out to 2028, with free cash flow expected to reach around $567.3 million, and Simply Wall St extrapolates the subsequent years, with projections rising to roughly $632.6 million by 2035 as growth moderates.
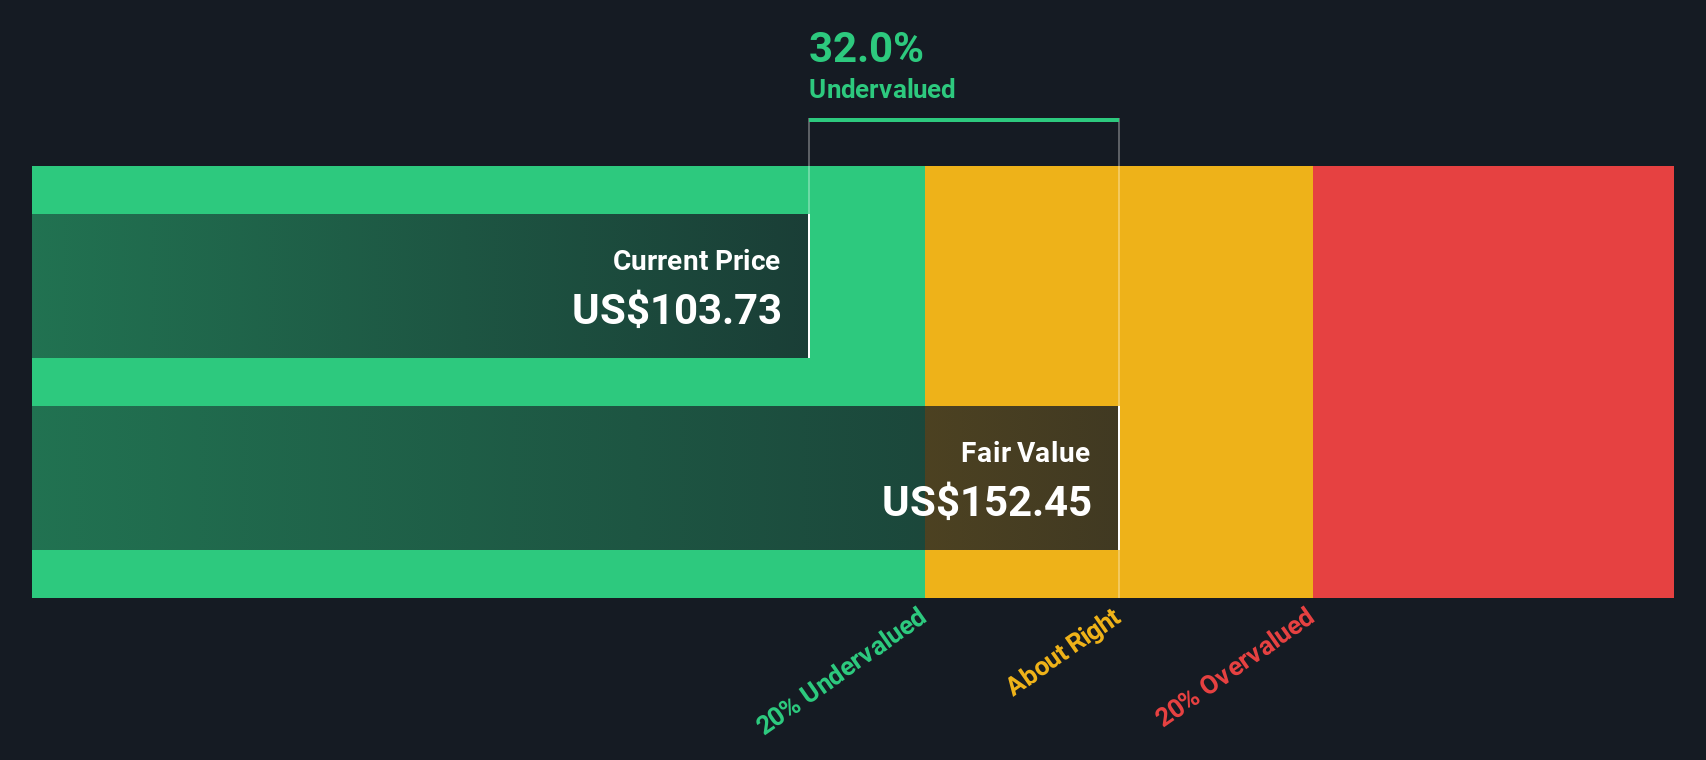
When all those future cash flows are discounted back, the DCF suggests an intrinsic value of about $196.38 per share. Compared with the current market price, this implies the stock is trading at a 52.8% discount to its estimated fair value, indicating potential upside if the cash flow assumptions play out.
Result: UNDERVALUED
Our Discounted Cash Flow (DCF) analysis suggests Signet Jewelers is undervalued by 52.8%. Track this in your watchlist or portfolio, or discover 908 more undervalued stocks based on cash flows.
Approach 2: Signet Jewelers Price vs Earnings
For profitable companies like Signet, the price to earnings, or PE, ratio is a useful way to gauge whether investors are paying a reasonable price for each dollar of profit. A higher PE can be justified when a business is expected to grow faster or is seen as lower risk, while slower growth or higher uncertainty typically warrant a lower, more conservative PE multiple.
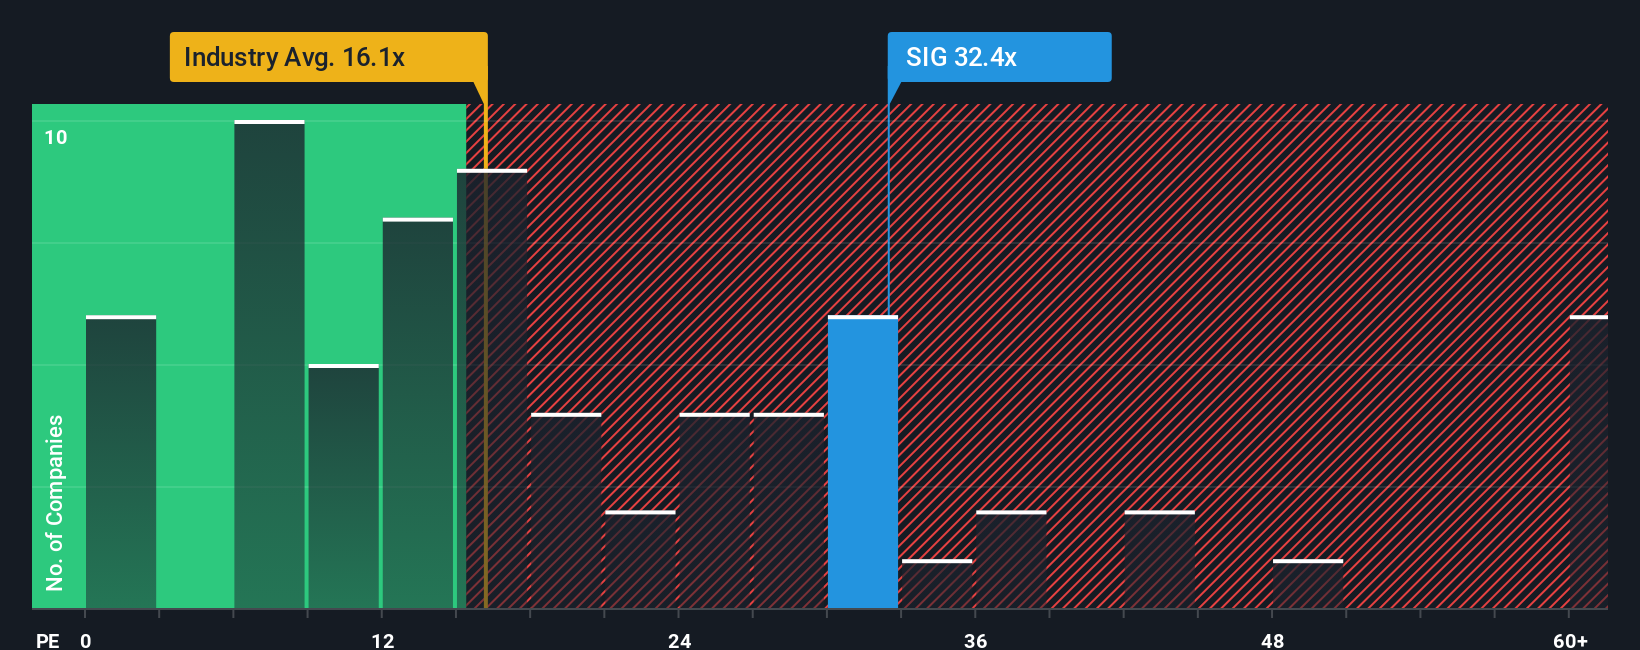
Signet currently trades on a PE of about 26.0x, above the Specialty Retail industry average of roughly 19.7x and higher than the peer group average of around 15.0x. On the surface, that premium suggests the market is already baking in stronger prospects than the typical retailer in its space.
Simply Wall St goes a step further with its Fair Ratio, which estimates what PE you might expect for Signet given its specific earnings growth outlook, profitability, industry, size and risk profile. For Signet, that Fair Ratio is about 30.0x, implying the stock arguably deserves a higher multiple than the market is currently assigning. Because this framework is tailored to the company rather than just broad peer comparisons, it can provide a more nuanced view of value. With the Fair Ratio above the actual PE, Signet appears modestly undervalued on this lens.
Result: UNDERVALUED
PE ratios tell one story, but what if the real opportunity lies elsewhere? Discover 1447 companies where insiders are betting big on explosive growth.
Upgrade Your Decision Making: Choose your Signet Jewelers Narrative
Earlier we mentioned that there is an even better way to understand valuation, so let us introduce you to Narratives, a simple way to connect your view of a company with a financial forecast and a fair value estimate that you can use to make informed decisions.
A Narrative is your story behind the numbers, where you spell out what you believe about Signet's future revenue, earnings and margins, link that story to a set of projections, and see what fair value those assumptions imply.
On Simply Wall St's Community page, used by millions of investors, Narratives make this process easy and accessible, turning your perspective into a live valuation that compares fair value to the current share price so you can quickly see how your story translates into potential outcomes.
Because Narratives update dynamically as new information such as news, earnings or guidance comes in, your fair value view automatically adjusts instead of going stale.
For example, one Signet Narrative might focus on digital growth, younger customers and margin expansion, leading to a fair value closer to the most bullish 130 dollars target. A more cautious Narrative might emphasize structural demand risks and margin pressure, leading to a fair value closer to the bearish 90 dollars view.
Do you think there's more to the story for Signet Jewelers? Head over to our Community to see what others are saying!
This article by Simply Wall St is general in nature. We provide commentary based on historical data and analyst forecasts only using an unbiased methodology and our articles are not intended to be financial advice. It does not constitute a recommendation to buy or sell any stock, and does not take account of your objectives, or your financial situation. We aim to bring you long-term focused analysis driven by fundamental data. Note that our analysis may not factor in the latest price-sensitive company announcements or qualitative material. Simply Wall St has no position in any stocks mentioned.
Have feedback on this article? Concerned about the content? Get in touch with us directly. Alternatively, email editorial-team@simplywallst.com