
 Nasdaq
 華爾街日報
華爾街日報Does Molina Healthcare’s 2025 Valuation Reflect Its Sharp Share Price Decline and Rebound?
- If you are wondering whether Molina Healthcare is a quietly compelling value play or a stock to avoid at current levels, you are not alone. This article is going to unpack that in plain English.
- After falling sharply over the longer term, with the share price down 44.1% year to date and 46.5% over the last year, the stock has recently bounced with a 7.7% gain over the past week and 13.9% over the last 30 days from a last close of $160.52.
- Much of the recent price action has been driven by shifting sentiment around managed care names and evolving expectations on Medicaid and Medicare Advantage policy, as investors re-evaluate which insurers are best positioned in a tougher reimbursement environment. At the same time, Molina has been in focus for its execution on government-focused health plans and its positioning in key state contracts. This context frames how the market is repricing both its risks and its long term cash flow potential.
- On our framework, Molina scores a 5/6 valuation check, suggesting it screens as undervalued on most of the metrics we track. Next we will walk through what different valuation approaches indicate about that number, before ending with a way to think more deeply about what the stock may be worth.
Find out why Molina Healthcare's -46.5% return over the last year is lagging behind its peers.
Approach 1: Molina Healthcare Discounted Cash Flow (DCF) Analysis
A Discounted Cash Flow, or DCF, model estimates what a company is worth by projecting the cash it can generate in the future and then discounting those cash flows back to today in dollar terms.
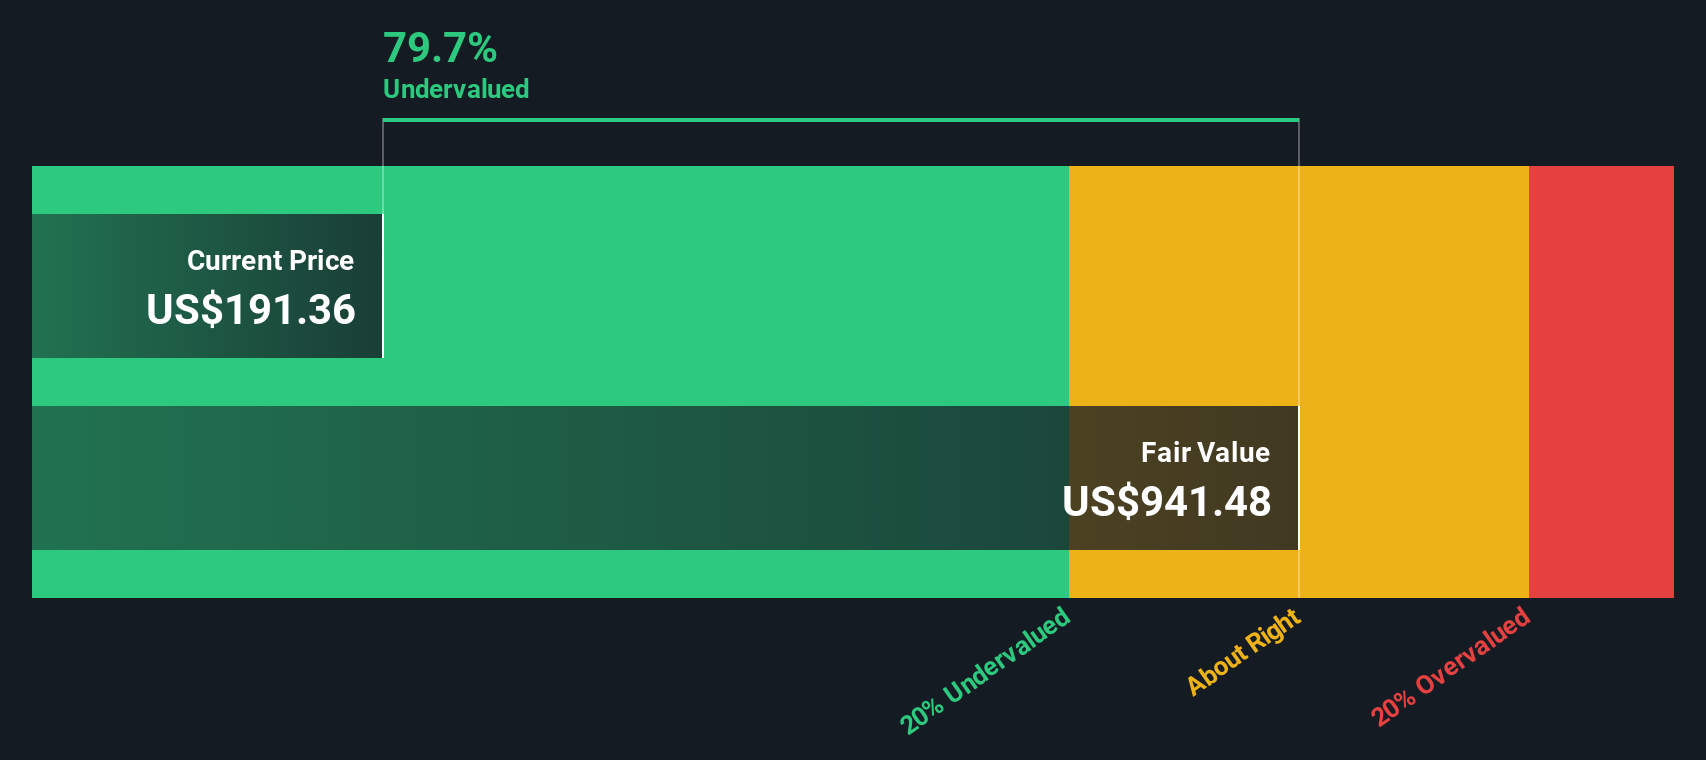
For Molina Healthcare, the latest twelve month Free Cash Flow is about $573 million in the red, which partly reflects volatility in working capital and government contract timing. Analysts expect this to swing positive and grow, with projections rising to around $1.23 billion in Free Cash Flow by 2029, and further extrapolated estimates approaching $1.70 billion by 2035.
Using a 2 Stage Free Cash Flow to Equity model built on those projections, Simply Wall St estimates an intrinsic value of about $649 per share. Compared with the recent share price near $160, the model implies the stock is roughly 75.3% undervalued on a cash flow basis.
Result: UNDERVALUED
Our Discounted Cash Flow (DCF) analysis suggests Molina Healthcare is undervalued by 75.3%. Track this in your watchlist or portfolio, or discover 909 more undervalued stocks based on cash flows.
Approach 2: Molina Healthcare Price vs Earnings
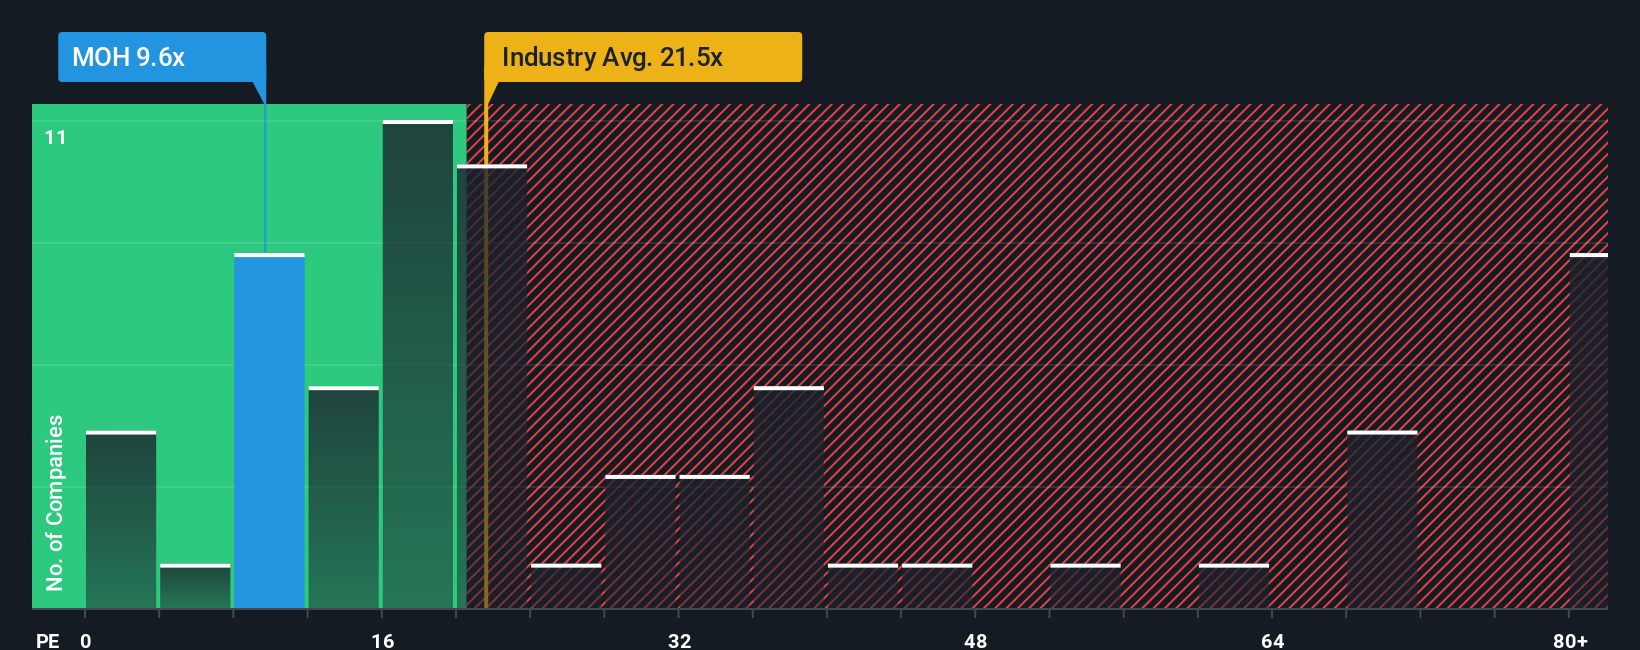
For profitable companies like Molina Healthcare, the price to earnings, or PE, ratio is a straightforward way to judge whether investors are paying a sensible price for each dollar of profit. A higher PE generally reflects stronger expected growth or lower perceived risk, while a lower PE suggests weaker growth, higher risk, or simply a bargain if those fears are overdone.
Molina currently trades on a PE of about 9.3x, which is far below both the broader Healthcare industry average of roughly 23.3x and the peer group average of around 29.7x. On the surface, that big discount implies the market is assigning Molina meaningfully lower growth or higher risk than its managed care peers.
Simply Wall St also estimates a proprietary Fair Ratio for Molina of about 22.5x. This is the PE the stock might reasonably trade at given its earnings growth outlook, margins, industry, market cap and risk profile. This Fair Ratio is more tailored than a simple comparison with sector averages or peers, because it explicitly adjusts for company specific fundamentals rather than assuming every insurer deserves the same multiple. Comparing Molina’s actual PE of 9.3x with the Fair Ratio of 22.5x suggests the market is pricing the stock well below what its fundamentals would justify.
Result: UNDERVALUED
PE ratios tell one story, but what if the real opportunity lies elsewhere? Discover 1446 companies where insiders are betting big on explosive growth.
Upgrade Your Decision Making: Choose your Molina Healthcare Narrative
Earlier we mentioned that there is an even better way to understand valuation, so let us introduce you to Narratives, a simple way to connect the story you believe about Molina Healthcare with the numbers behind it, from your assumptions on future revenue, earnings and margins through to your own estimate of fair value. A Narrative on Simply Wall St’s Community page lets you spell out why you think contracts like Florida or Virginia will play out a certain way, link that story to a financial forecast, and then see what fair value it implies so you can compare it with today’s share price and decide whether you would buy, hold or sell. Narratives update dynamically as new news, earnings or guidance arrive, so your fair value view evolves along with the business rather than staying frozen in time. For example, one investor might build a bullish Molina Narrative around successful RFP wins, disciplined medical cost management and a fair value closer to the top analyst target of about $330. A more cautious investor could instead focus on Medicaid funding risks and margin pressure and land nearer the low end around $153, with both perspectives transparently grounded in explicit assumptions rather than vague hunches.
Do you think there's more to the story for Molina Healthcare? Head over to our Community to see what others are saying!

This article by Simply Wall St is general in nature. We provide commentary based on historical data and analyst forecasts only using an unbiased methodology and our articles are not intended to be financial advice. It does not constitute a recommendation to buy or sell any stock, and does not take account of your objectives, or your financial situation. We aim to bring you long-term focused analysis driven by fundamental data. Note that our analysis may not factor in the latest price-sensitive company announcements or qualitative material. Simply Wall St has no position in any stocks mentioned.
Have feedback on this article? Concerned about the content? Get in touch with us directly. Alternatively, email editorial-team@simplywallst.com