
 Nasdaq
 華爾街日報
華爾街日報Is It Too Late to Consider Centrus Energy After Its 257% Surge in 2025?
- If you have been wondering whether Centrus Energy is still worth buying after its massive run up, you are not alone. This stock has quickly moved from niche nuclear play to front row on many investors watchlists.
- Even after a recent pullback of 1.3% over the last week and 8.8% over the last month, the share price is still up an eye catching 257.3% year to date and 252.3% over the past year, with longer term holders sitting on gains above 1,000% over five years.
- That turbocharged performance has been fueled by growing interest in nuclear power as a low carbon baseload option and policy moves that aim to secure Western fuel supply chains. This puts Centrus in a strategic spot in the enrichment ecosystem. On top of that, recurring headlines around advanced nuclear technologies and government support for uranium fuel have helped re rate sentiment toward specialized suppliers like Centrus, even as short term volatility reminds investors that expectations are running high.
- Despite all that excitement, Centrus currently scores just 0 out of 6 on our valuation checks. In the sections ahead we will unpack what different valuation methods say about the stock and, finally, explore a more holistic way to judge whether the current price truly reflects its long term potential.
Centrus Energy scores just 0/6 on our valuation checks. See what other red flags we found in the full valuation breakdown.
Approach 1: Centrus Energy Discounted Cash Flow (DCF) Analysis
A Discounted Cash Flow model estimates what a company is worth by projecting its future cash flows and then discounting them back to today, to see what that stream of cash is worth in present dollar terms.
For Centrus Energy, the latest twelve month Free Cash Flow is about $151.2 Million. Analysts and extrapolated estimates point to Free Cash Flow staying broadly around the low to mid $100 Million range over the next decade, with projections such as roughly $102.1 Million in 2026 rising to around $199.2 Million by 2035. These figures are modeled using a 2 Stage Free Cash Flow to Equity approach, where earlier analyst forecasts are followed by a more gradual, assumption driven growth phase, all expressed in $.
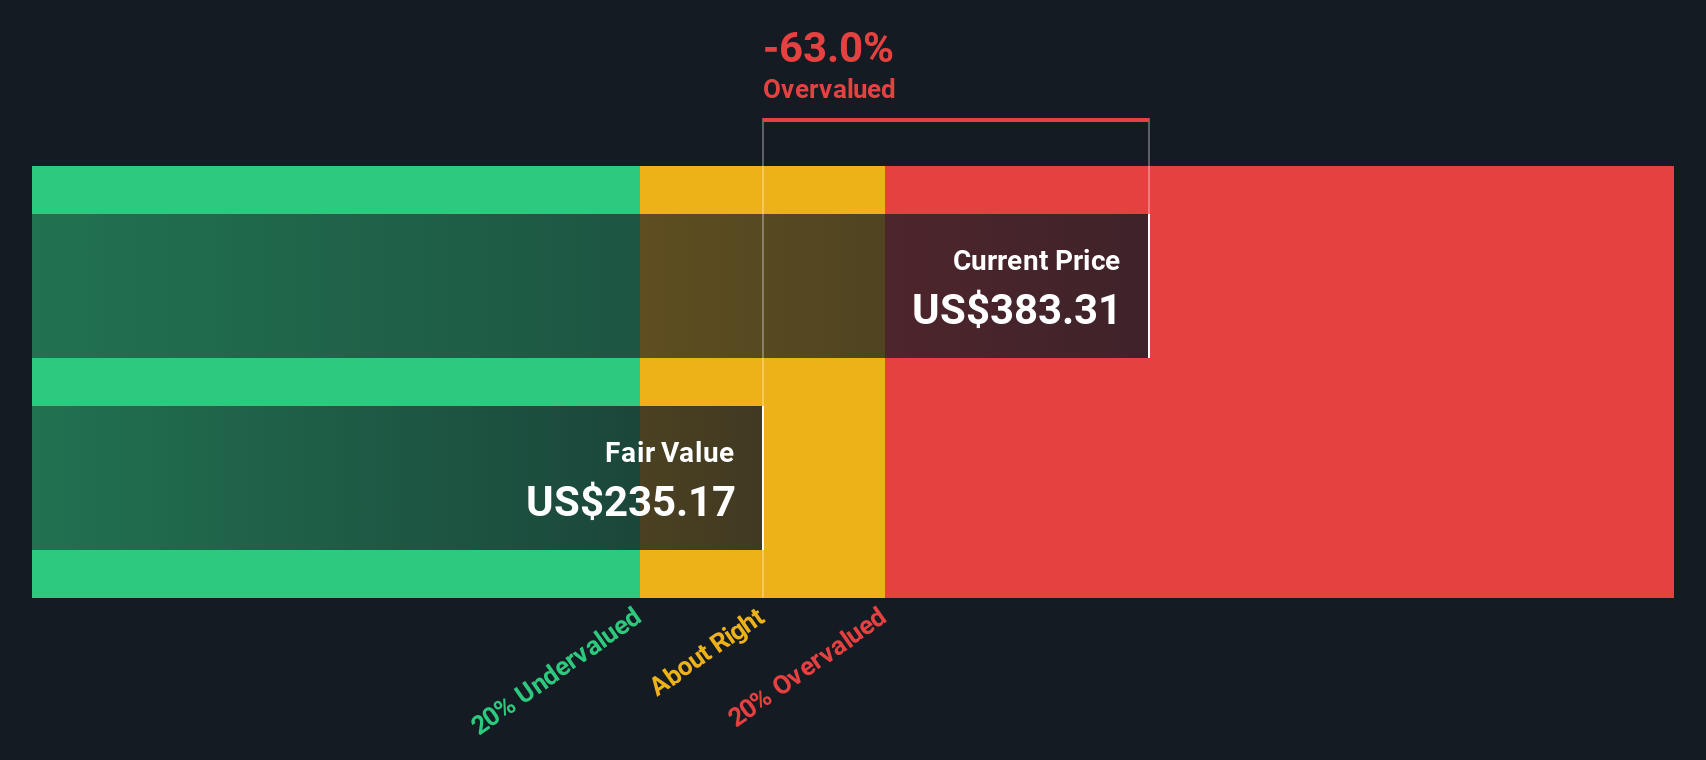
When all those future cash flows are discounted back, the DCF model suggests an intrinsic value of about $215.07 per share. Compared with the current market price, this implies the stock is roughly 23.0% overvalued, meaning investors today are paying a premium to the modeled cash flow outlook.
Result: OVERVALUED
Our Discounted Cash Flow (DCF) analysis suggests Centrus Energy may be overvalued by 23.0%. Discover 909 undervalued stocks or create your own screener to find better value opportunities.
Approach 2: Centrus Energy Price vs Earnings
For profitable companies like Centrus Energy, the price to earnings multiple is a straightforward way to gauge how much investors are willing to pay today for each dollar of current profits. In general, faster earnings growth and lower perceived risk justify a higher PE, while slower growth and higher uncertainty usually warrant a lower, more conservative multiple.
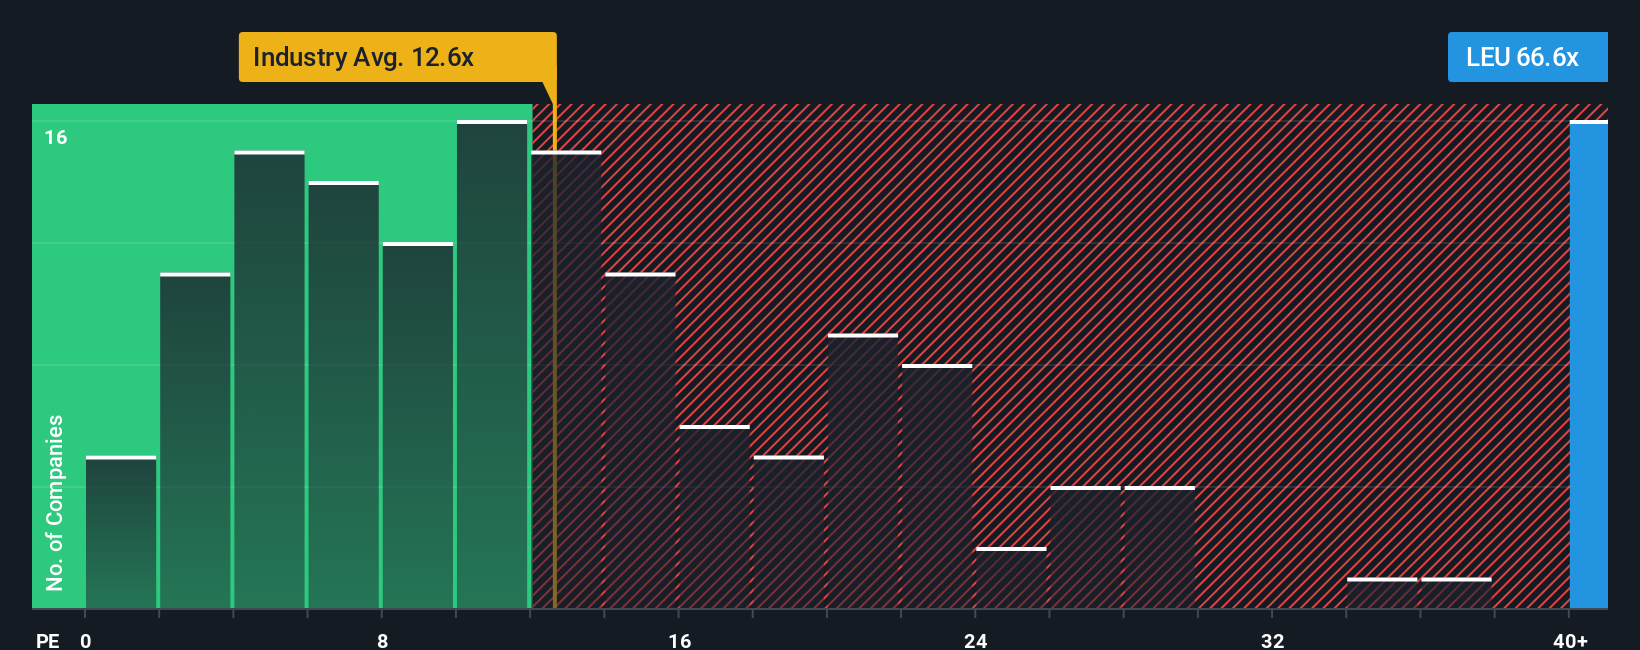
Centrus currently trades on a PE of about 42.4x, which is well above both the broader Oil and Gas industry average of roughly 13.6x and the peer group average of about 17.2x. To go beyond these simple comparisons, Simply Wall St also calculates a proprietary Fair Ratio, which estimates what PE you might reasonably expect for Centrus given its specific earnings growth outlook, profitability, industry, market cap and risk profile. For Centrus, that Fair Ratio is around 11.3x, suggesting the market is assigning a far richer valuation than those fundamentals alone would imply.
Because the actual PE of 42.4x is significantly higher than the 11.3x Fair Ratio, this approach indicates that the stock looks materially overvalued on an earnings multiple basis.
Result: OVERVALUED
PE ratios tell one story, but what if the real opportunity lies elsewhere? Discover 1446 companies where insiders are betting big on explosive growth.
Upgrade Your Decision Making: Choose your Centrus Energy Narrative
Earlier we mentioned that there is an even better way to understand valuation, so let us introduce you to Narratives, a simple way to connect your view of Centrus Energy’s future with a concrete financial forecast and a fair value estimate that updates as the story evolves.
A Narrative is your story behind the numbers, where you spell out what you think will happen to a company’s revenue, earnings and margins, then link those assumptions to an estimated fair value per share.
On Simply Wall St’s Community page, used by millions of investors, Narratives make this easy and accessible by turning your expectations into a structured forecast that can be directly compared with the current share price. This can help you consider whether Centrus may be more suitable as a potential buy, hold or sell candidate based on your own reasoning.
Because Narratives are updated dynamically when new information arrives, such as earnings reports, funding announcements or major contract wins, your fair value stays aligned with the latest developments rather than a static snapshot.
For Centrus, for example, one investor might build a Narrative that emphasizes rapid plant expansion, strong backlog conversion and a fair value closer to about $310 per share. Another might emphasize funding risk, dilution and slower demand to arrive at a much more cautious fair value near $108. By comparing each Narrative’s fair value to today’s price, investors can independently judge how the stock may fit into their own strategy.
Do you think there's more to the story for Centrus Energy? Head over to our Community to see what others are saying!

This article by Simply Wall St is general in nature. We provide commentary based on historical data and analyst forecasts only using an unbiased methodology and our articles are not intended to be financial advice. It does not constitute a recommendation to buy or sell any stock, and does not take account of your objectives, or your financial situation. We aim to bring you long-term focused analysis driven by fundamental data. Note that our analysis may not factor in the latest price-sensitive company announcements or qualitative material. Simply Wall St has no position in any stocks mentioned.
Have feedback on this article? Concerned about the content? Get in touch with us directly. Alternatively, email editorial-team@simplywallst.com