
 Nasdaq
 華爾街日報
華爾街日報Does Adyen’s Premium Valuation Still Make Sense After Recent Share Price Weakness?
- Wondering if Adyen is a quietly compelling opportunity or a value trap after its big run a few years ago? You are not alone, and this article is here to unpack what the current price is really asking you to believe.
- Today the stock trades around €1,333.8, with returns of -2.2% over the last week, -1.5% over the last month, and -11.3% over the past year. This tells us sentiment has cooled even as the long term payments story remains intact.
- Recently, the market has been digesting a mix of headlines around competition in global payments, changing consumer spending patterns, and Adyen's push to deepen its merchant relationships. At the same time, broader tech and fintech volatility has made investors more sensitive to execution risk and valuation. This has amplified price swings even on relatively modest pieces of news.
- On our framework, Adyen scores just 1/6 on the valuation checks, signaling that by traditional metrics it screens as expensive. Those checks, however, do not always capture platform quality, durability of growth, or strategic positioning. We will therefore first walk through the usual valuation approaches and then finish with a more complete way to think about what Adyen might really be worth.
Adyen scores just 1/6 on our valuation checks. See what other red flags we found in the full valuation breakdown.
Approach 1: Adyen Excess Returns Analysis
The Excess Returns model asks a simple question: how much value can Adyen create above the return that shareholders reasonably demand on their capital? Instead of focusing on near term earnings multiples, it looks at the profitability of equity invested in the business and the durability of those returns.
For Adyen, the starting point is a Book Value of €148.38 per share and a Stable EPS of €46.30 per share, based on forward looking return on equity estimates from 12 analysts. With an Average Return on Equity of 21.53% compared with a Cost of Equity of €11.84 per share, the model estimates an Excess Return of €34.46 per share. As Adyen reinvests and grows its equity base toward a Stable Book Value of €215.06 per share, that spread between what it earns and what investors require compounds into intrinsic value.
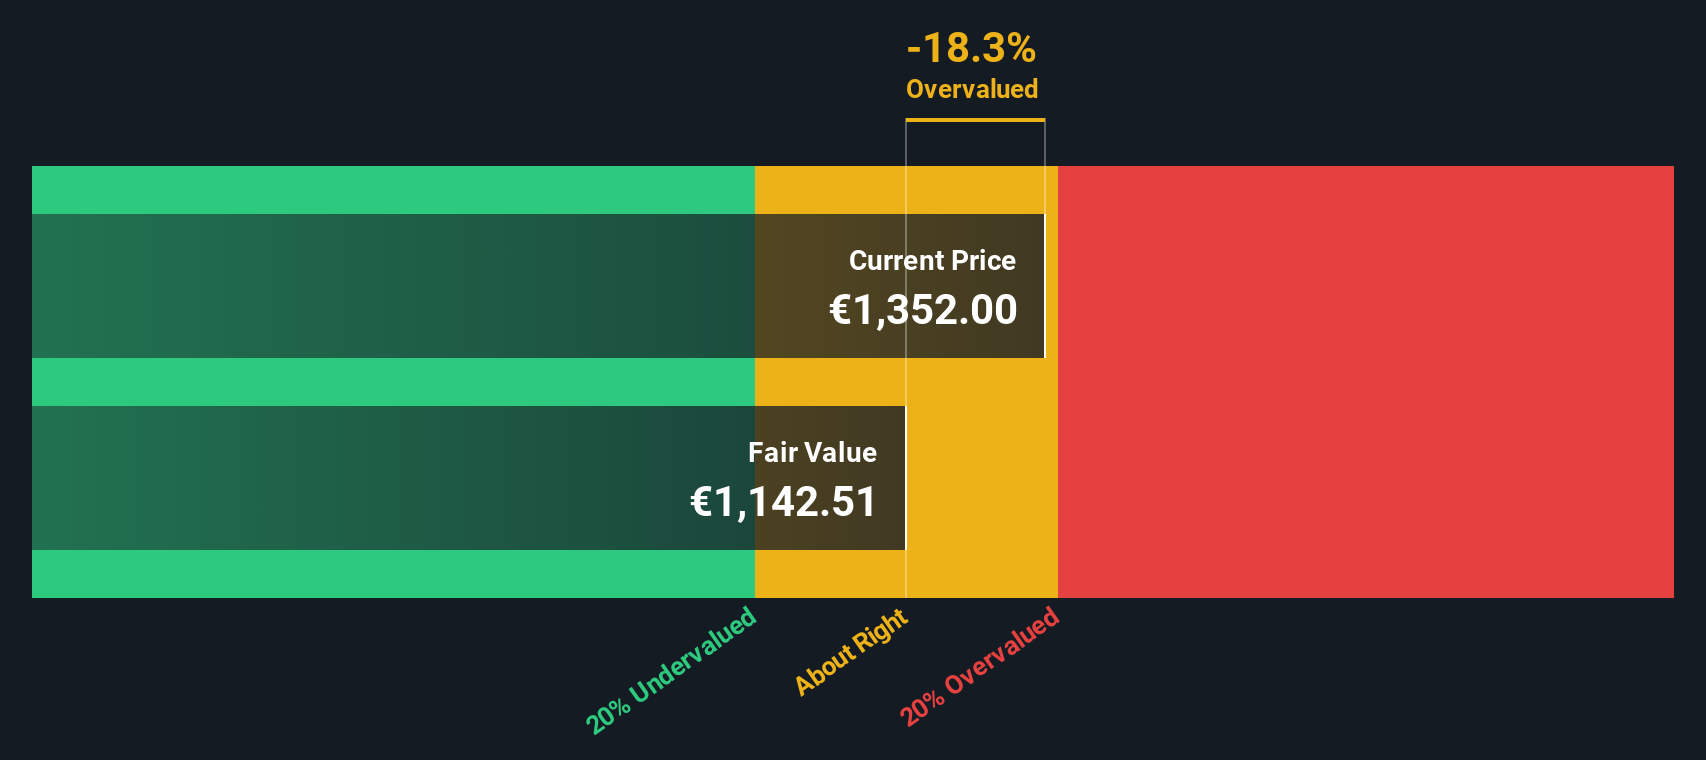
On this framework, the Excess Returns valuation implies a fair value of about €1,145 per share, meaning Adyen appears roughly 16.5% overvalued versus the current price near €1,334.
Result: OVERVALUED
Our Excess Returns analysis suggests Adyen may be overvalued by 16.5%. Discover 904 undervalued stocks or create your own screener to find better value opportunities.
Approach 2: Adyen Price vs Earnings
For a profitable, scalable platform like Adyen, the price to earnings ratio is a useful yardstick because it links what investors pay today with the earnings the business is already generating. In general, stronger growth and lower perceived risk justify a higher, or more generous, PE multiple. Slower growth or higher uncertainty pull that “normal” multiple down.
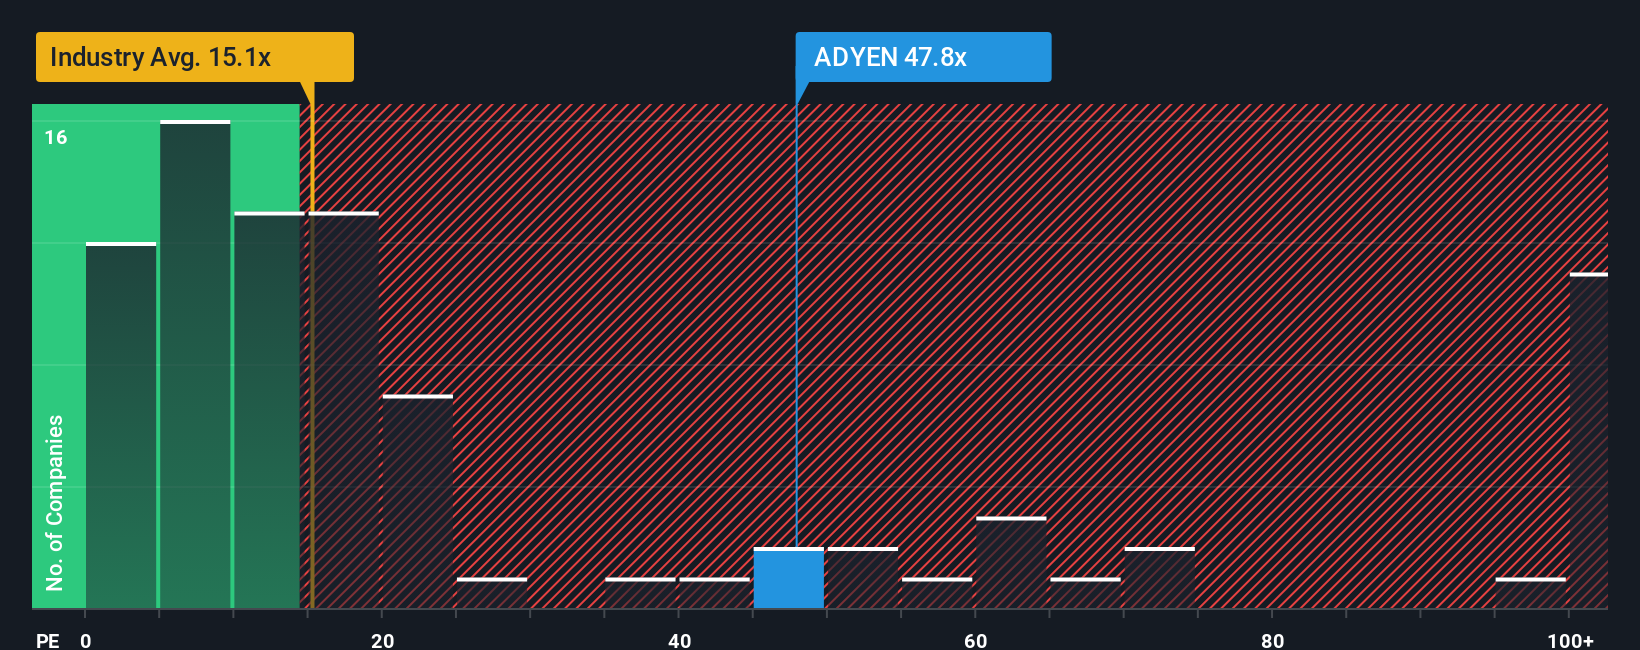
Adyen currently trades on a PE of about 42.17x, which is well above the Diversified Financial industry average of roughly 14.01x and the broader peer average of 12.58x. On those simple comparisons the stock looks expensive. However, Simply Wall St’s Fair Ratio framework goes a step further by estimating what PE Adyen should command, given its earnings growth outlook, profitability, size, sector and risk profile. For Adyen, that Fair Ratio sits at around 20.74x, far below the present 42.17x.
Because the Fair Ratio explicitly bakes in growth, margins, risk and industry context, it offers a richer benchmark than blunt peer or sector comparisons. On this basis, Adyen’s current PE suggests investors are paying materially more than is justified by its fundamentals.
Result: OVERVALUED
PE ratios tell one story, but what if the real opportunity lies elsewhere? Discover 1446 companies where insiders are betting big on explosive growth.
Upgrade Your Decision Making: Choose your Adyen Narrative
Earlier we mentioned that there is an even better way to understand valuation, so let us introduce you to Narratives, a simple tool that lets you attach a story and your view on Adyen’s products, competition and growth drivers to the numbers, such as your fair value estimate, expected revenue growth and future margins.
A Narrative connects three things in one place: the company’s story, a concrete financial forecast and the resulting fair value, so you can clearly see what needs to happen for your view to be right.
On Simply Wall St’s Community page, used by millions of investors, Narratives are easy to explore and create. They automatically update when fresh information like earnings or major news arrives, so your thesis never goes stale.
Narratives can also help you decide how to act by comparing your fair value to the current price. For example, one Adyen Narrative might assume earnings reach about €1.8 billion by 2028 and justify a fair value near the bullish €2,450 target. Another more cautious investor could expect only €1.4 billion of earnings and a fair value closer to €1,400, and the platform lets you see and stress test both perspectives side by side in seconds.
Do you think there's more to the story for Adyen? Head over to our Community to see what others are saying!

This article by Simply Wall St is general in nature. We provide commentary based on historical data and analyst forecasts only using an unbiased methodology and our articles are not intended to be financial advice. It does not constitute a recommendation to buy or sell any stock, and does not take account of your objectives, or your financial situation. We aim to bring you long-term focused analysis driven by fundamental data. Note that our analysis may not factor in the latest price-sensitive company announcements or qualitative material. Simply Wall St has no position in any stocks mentioned.
Have feedback on this article? Concerned about the content? Get in touch with us directly. Alternatively, email editorial-team@simplywallst.com