
 Nasdaq
 華爾街日報
華爾街日報Is It Too Late To Consider Comstock Resources After Its Strong Five Year Run?
- If you are wondering whether Comstock Resources is still a smart way to play natural gas or if the market has already priced in the story, you are in the right place.
- The stock has pulled back about 13.7% over the last week and is down 2.2% over the past month, but it is still up 23.6% year to date and 36.8% over the last year, with a 438.2% gain over five years.
- Recent moves in natural gas prices and shifting expectations around US production discipline have kept Comstock in the spotlight, as investors weigh how cyclical gas markets could impact future cash flows. At the same time, ongoing industry chatter about infrastructure constraints and policy developments has added another layer of complexity to how the market is pricing gas-focused names.
- Despite all that noise, Comstock scores just 0/6 on our valuation checks. This means the market is not flagging it as clearly undervalued on any of our basic metrics right now. We will unpack what that actually means by walking through several valuation methods, before finishing with a more intuitive way to think about value that goes beyond the usual numbers.
Comstock Resources scores just 0/6 on our valuation checks. See what other red flags we found in the full valuation breakdown.
Approach 1: Comstock Resources Discounted Cash Flow (DCF) Analysis
A Discounted Cash Flow model looks at the cash Comstock Resources is expected to generate in the future, then discounts those projections back to what they are worth in $ today. It is essentially a way of translating future free cash flow into a single present value per share.
Comstock’s last twelve months Free Cash Flow was negative at around $396 million, reflecting a period of heavy investment and weaker gas pricing. Analysts expect this to flip into positive territory, with free cash flow projected to reach about $263 million by 2028. Simply Wall St then extrapolates modest growth thereafter through 2035.
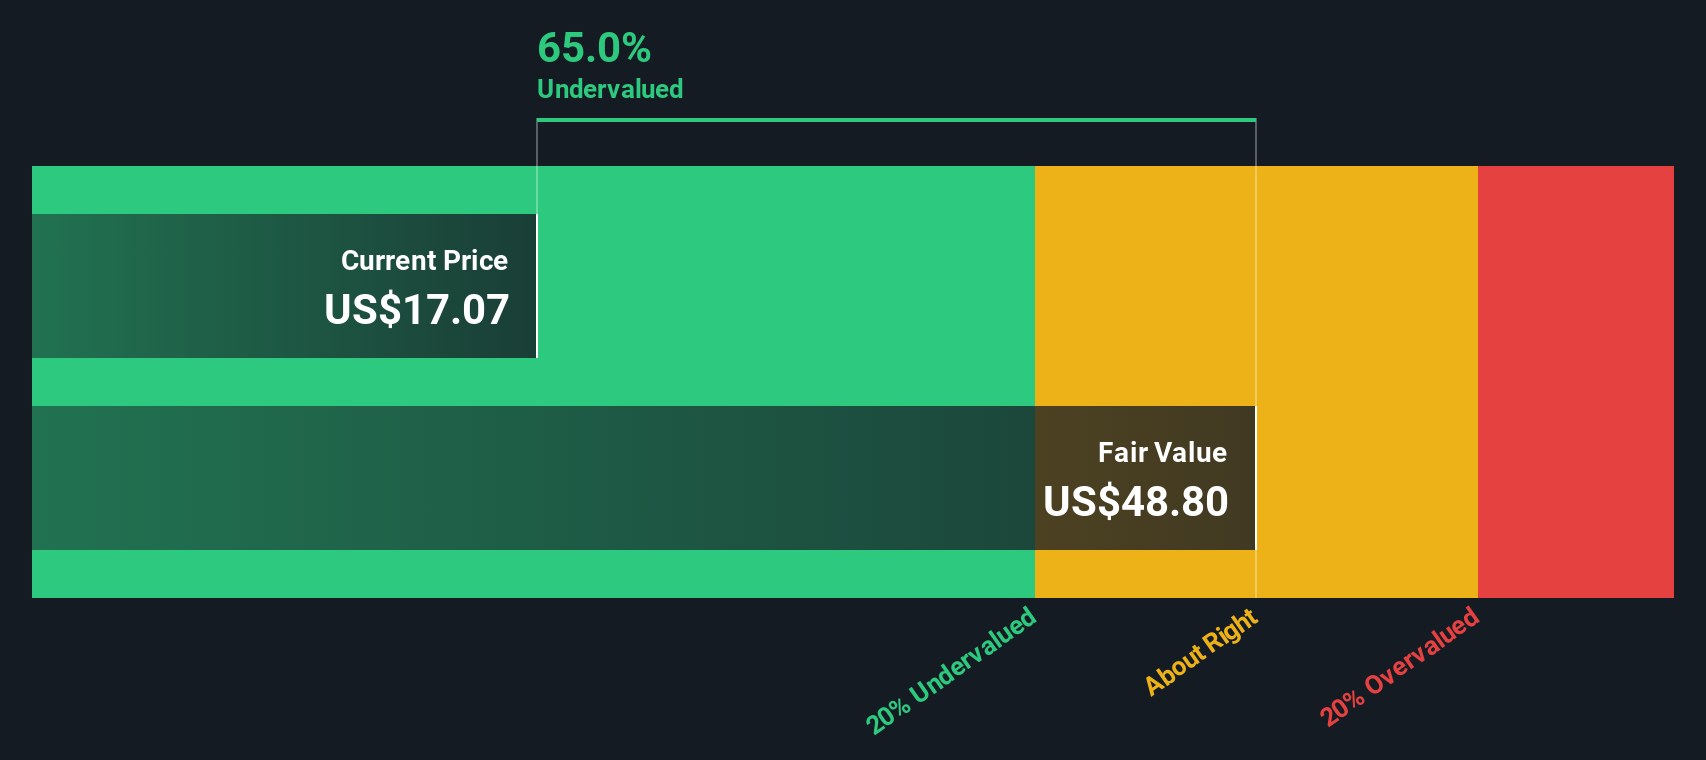
Pulling these forecasts together in a 2 Stage Free Cash Flow to Equity model yields an estimated intrinsic value of roughly $21.61 per share. Compared with the current share price, that implies the stock is about 6.9% overvalued, which is a relatively small gap and well within normal modeling uncertainty.
Result: ABOUT RIGHT
Comstock Resources is fairly valued according to our Discounted Cash Flow (DCF), but this can change at a moment's notice. Track the value in your watchlist or portfolio and be alerted on when to act.
Approach 2: Comstock Resources Price vs Earnings
For companies that are generating positive earnings, the Price to Earnings ratio is often the most intuitive way to gauge valuation because it directly links what investors pay today with the profits the business is producing.
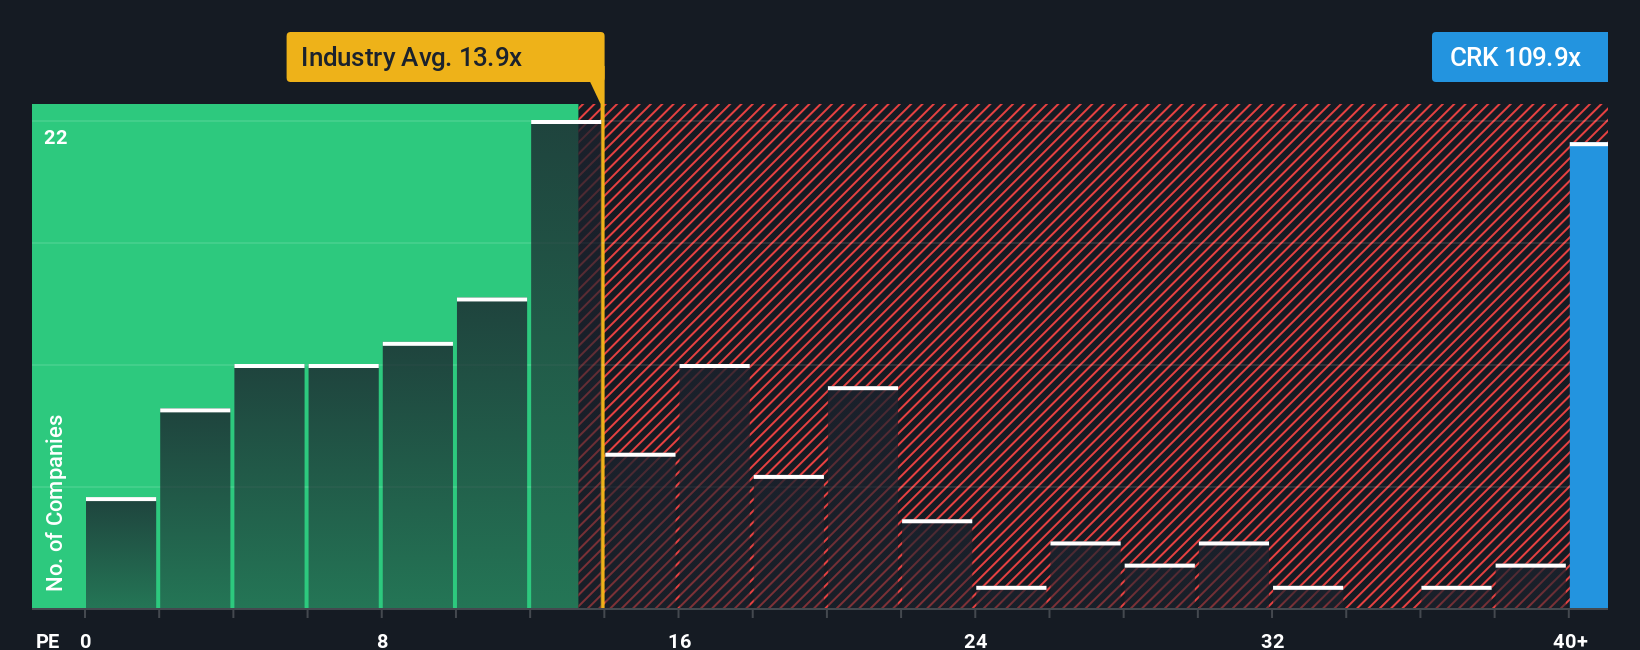
In general, faster growing and lower risk businesses can justify a higher PE, while slower growth or higher uncertainty usually warrants a lower multiple. With that in mind, Comstock currently trades on a rich PE of about 100.4x, well above both the broader Oil and Gas industry average of roughly 13.6x and its peer group around 24.6x, suggesting the market is baking in strong growth and a fair amount of optimism.
Simply Wall St’s Fair Ratio framework refines this comparison by estimating the PE Comstock should trade on given its specific earnings growth outlook, profitability, size, industry and risk profile. This yields a Fair Ratio of about 26.6x, which is more tailored than a simple peer or industry comparison because it adjusts for the company’s own fundamentals rather than assuming one size fits all. Against that benchmark, the current 100.4x multiple looks stretched, implying the shares are pricing in more than the model thinks is justified.
Result: OVERVALUED
PE ratios tell one story, but what if the real opportunity lies elsewhere? Discover 1446 companies where insiders are betting big on explosive growth.
Upgrade Your Decision Making: Choose your Comstock Resources Narrative
Earlier we mentioned that there is an even better way to understand valuation. Let us introduce you to Narratives, a simple way to attach a clear story to your numbers by setting your own expectations for Comstock Resources future revenue, earnings, margins and fair value. You can then link that story to a forecast and a buy or sell decision based on how your Fair Value compares with the current share price, all within the Narratives tool on Simply Wall St’s Community page. Millions of investors use this tool, which automatically updates your view as new news or earnings are released.
For example, one investor might build a bullish Comstock Narrative around the high end of current fair value and price targets, focusing on Haynesville scale, LNG demand and capital efficiency. Another might anchor a far more cautious Narrative on the low end of the target range, emphasizing concentration risk, weaker near term returns and slower gas price recovery. Each Narrative produces its own dynamic fair value that makes it easier to decide when the stock looks attractive or stretched.
Do you think there's more to the story for Comstock Resources? Head over to our Community to see what others are saying!

This article by Simply Wall St is general in nature. We provide commentary based on historical data and analyst forecasts only using an unbiased methodology and our articles are not intended to be financial advice. It does not constitute a recommendation to buy or sell any stock, and does not take account of your objectives, or your financial situation. We aim to bring you long-term focused analysis driven by fundamental data. Note that our analysis may not factor in the latest price-sensitive company announcements or qualitative material. Simply Wall St has no position in any stocks mentioned.
Have feedback on this article? Concerned about the content? Get in touch with us directly. Alternatively, email editorial-team@simplywallst.com