
 Nasdaq
 華爾街日報
華爾街日報Is Marsh & McLennan Still Attractive After a 15% Pullback and Mixed Valuation Signals?
- Wondering if Marsh & McLennan Companies is still worth buying after a long run up, or if the market has finally pushed this blue chip too far? This article will walk through what the current share price really implies about future returns.
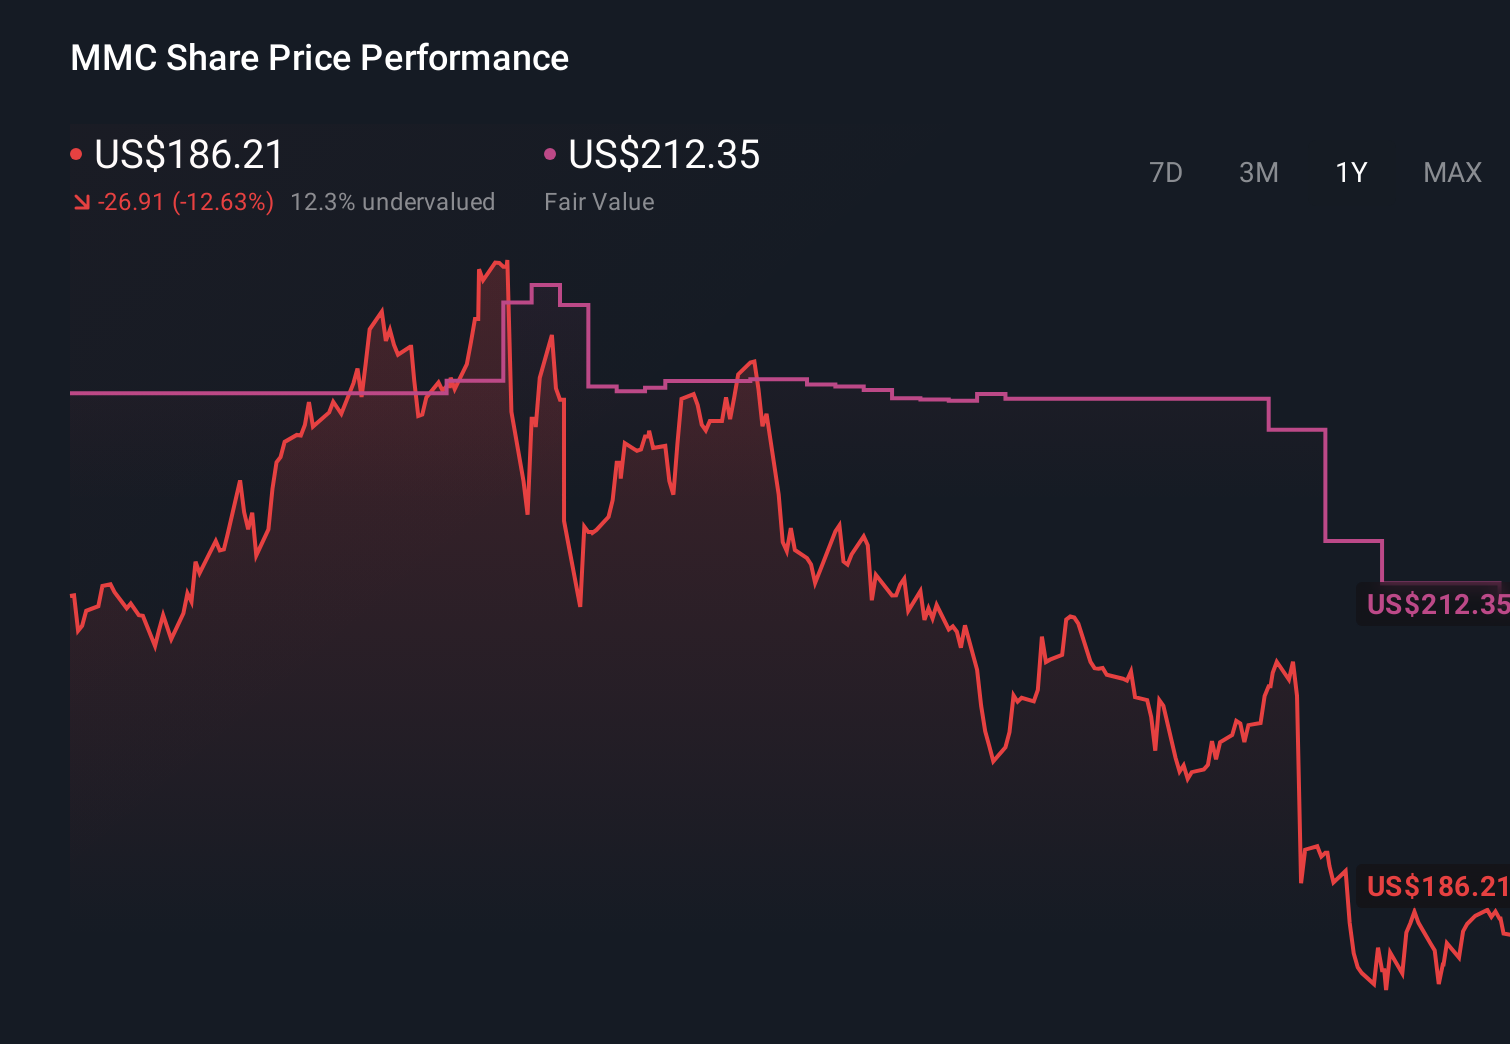
- The stock has drifted lower recently, with shares down 1.2% over the last week, 0.5% over the last month, and about 14.9% over the past year, even though the 3 year and 5 year returns of 12.5% and 64.1% still show a solid long term compounding story.
- That pullback has come as investors digest a steady stream of sector wide headlines around insurance pricing cycles, evolving climate risk exposures, and ongoing regulatory scrutiny of large brokers. All of these factors can reshape how the market prices Marsh & McLennan's cash flows. At the same time, strategic moves such as expanding its risk and consulting capabilities, plus continued integration of past acquisitions, are quietly strengthening the underlying business that sits behind the ticker.
- On our framework, Marsh & McLennan scores a 3 out of 6 on valuation checks, suggesting the shares are not screamingly cheap but may hide pockets of value depending on the lens you use. Next we will break that down through traditional valuation approaches, before finishing with a more nuanced way to think about what this business is really worth.
Approach 1: Marsh & McLennan Companies Excess Returns Analysis
The Excess Returns model looks at how much profit a company generates over and above the minimum return required by shareholders, then capitalizes those extra profits into an intrinsic value per share.
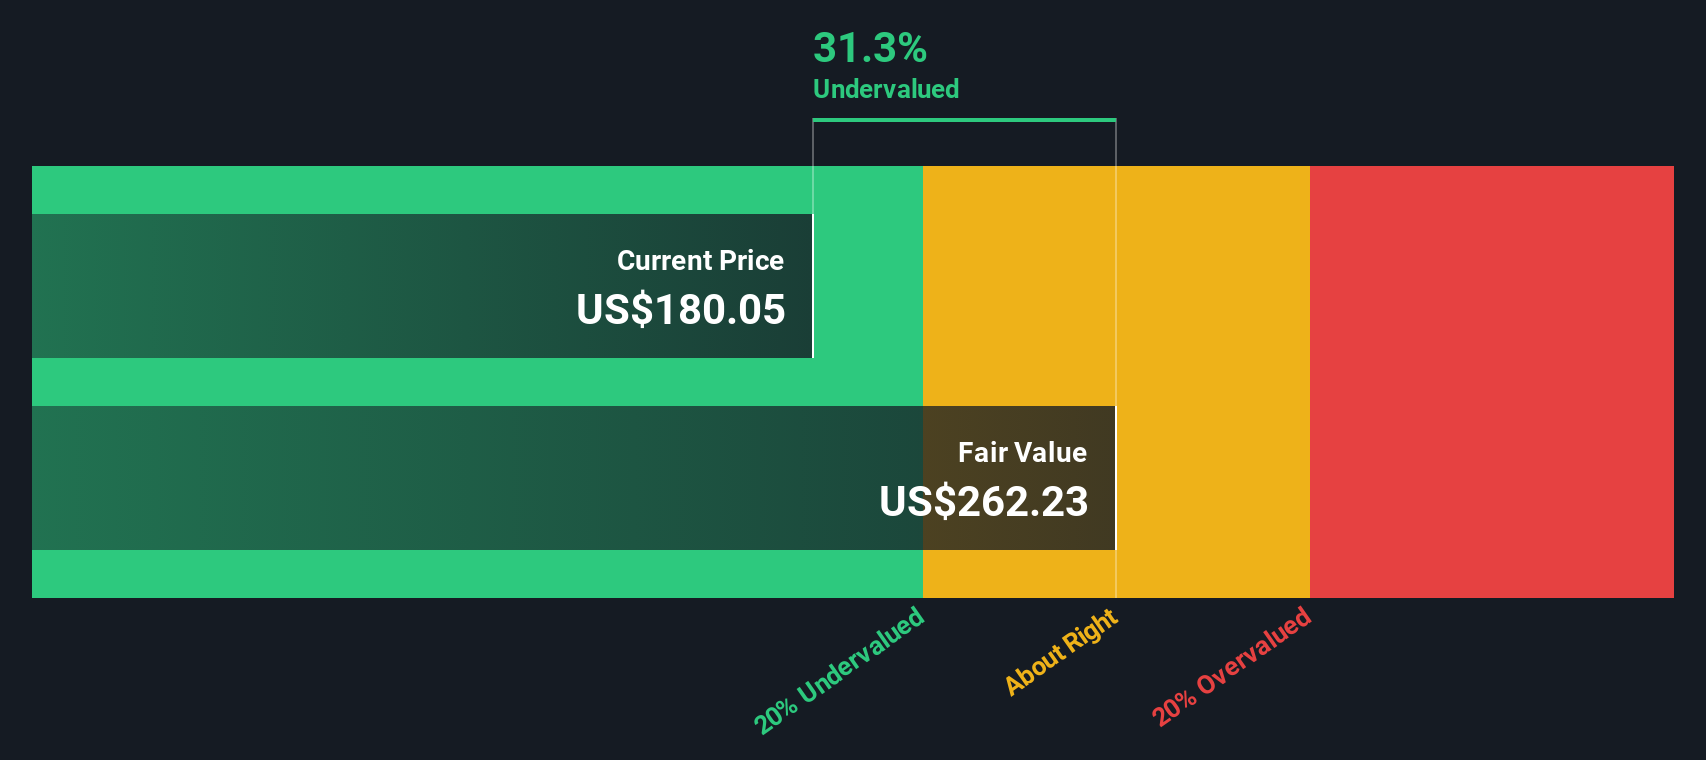
For Marsh & McLennan, the starting point is a Book Value of $30.92 per share and a Stable EPS of $10.87 per share, based on weighted future Return on Equity estimates from 6 analysts. With an Average Return on Equity of 29.81% and a Cost of Equity of $2.54 per share, the model estimates an Excess Return of $8.33 per share, meaning the business is expected to earn well above its required return.
Analysts also see the Stable Book Value rising to about $36.45 per share, supported by forecasts from 4 analysts. Plugging these assumptions into the Excess Returns framework yields an intrinsic value of roughly $261.87 per share. This implies that, under these assumptions, Marsh & McLennan is about 30.9% undervalued versus its current market price.
Result: UNDERVALUED
Our Excess Returns analysis suggests Marsh & McLennan Companies is undervalued by 30.9%. Track this in your watchlist or portfolio, or discover 907 more undervalued stocks based on cash flows.
Approach 2: Marsh & McLennan Companies Price vs Earnings
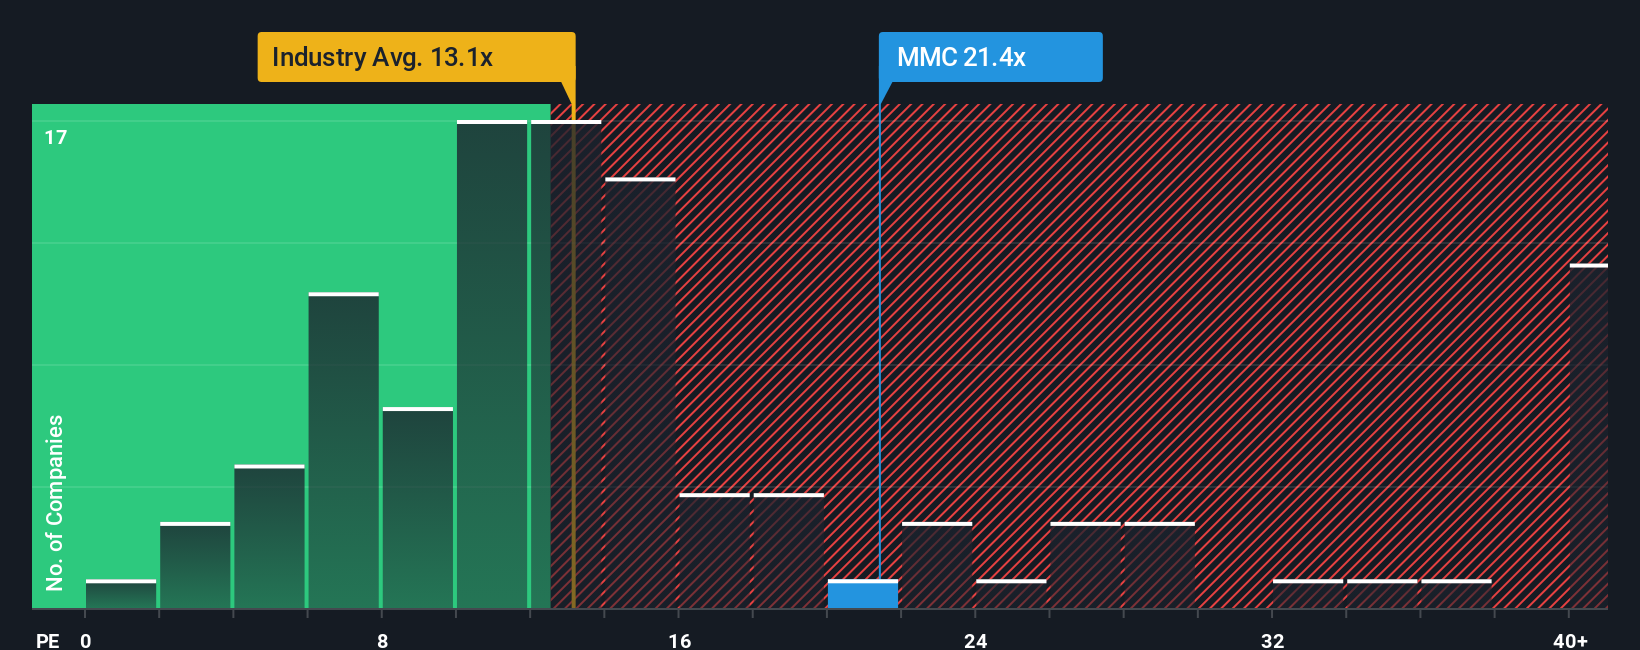
For a profitable, mature business like Marsh & McLennan, the price to earnings ratio is a useful shorthand for how much investors are willing to pay today for each dollar of current earnings. It ties directly to the bottom line and is widely used for insurance brokers, where earnings are relatively steady through the cycle.
What counts as a normal or fair PE depends on how fast profits are expected to grow and how risky those profits are. Higher growth and stronger competitive positions usually justify a higher multiple, while more cyclical or risky earnings should trade on a discount. Marsh & McLennan currently trades on about 21.5x earnings, which is a premium to the broader Insurance industry average of roughly 13.1x, but a discount to the peer group average of around 26.6x. This suggests investors see it as higher quality than the sector overall, but not the most richly valued name in its niche.
Simply Wall St’s Fair Ratio framework goes a step further by estimating the PE you would expect for Marsh & McLennan given its specific mix of earnings growth, profit margins, risk profile, industry and market cap. On that basis, the stock’s Fair Ratio is about 14.8x, well below the current 21.5x, implying that once you adjust for those fundamentals the shares screen as expensive rather than just relatively fully valued.
Result: OVERVALUED
PE ratios tell one story, but what if the real opportunity lies elsewhere? Discover 1446 companies where insiders are betting big on explosive growth.
Upgrade Your Decision Making: Choose your Marsh & McLennan Companies Narrative
Earlier we mentioned that there is an even better way to understand valuation. Let us introduce you to Narratives, a simple way to turn your view of Marsh & McLennan into a story backed by numbers. You spell out how you think revenue, earnings and margins will evolve, link that story to a financial forecast, and arrive at your own Fair Value that you can easily compare with today’s share price on Simply Wall St’s Community page. This then updates automatically as new news or earnings arrive, helping you quickly see whether your Narrative still holds up or needs adjusting. For example, a more optimistic investor who believes earnings can reach the higher analyst targets and justify something closer to the top end of recent price targets around $258 can set a higher Fair Value. A more cautious investor who worries about a softer insurance cycle and leans toward the lower targets near $197 will anchor their Narrative to more modest growth and a lower Fair Value. This can make buy or sell decisions far more intentional and transparent.
Do you think there's more to the story for Marsh & McLennan Companies? Head over to our Community to see what others are saying!
This article by Simply Wall St is general in nature. We provide commentary based on historical data and analyst forecasts only using an unbiased methodology and our articles are not intended to be financial advice. It does not constitute a recommendation to buy or sell any stock, and does not take account of your objectives, or your financial situation. We aim to bring you long-term focused analysis driven by fundamental data. Note that our analysis may not factor in the latest price-sensitive company announcements or qualitative material. Simply Wall St has no position in any stocks mentioned.
Have feedback on this article? Concerned about the content? Get in touch with us directly. Alternatively, email editorial-team@simplywallst.com