
 Nasdaq
 華爾街日報
華爾街日報Cloetta (OM:CLA B) Valuation Check as CandyKing Launches First Permanent Swedish Candy Store in New York
Cloetta (OM:CLA B) just took a tangible step into the U.S. candy aisle, with subsidiary CandyKing opening a permanent Swedish Candy store in New York City, a move worth watching for long term brand building.
See our latest analysis for Cloetta.
That New York foothold comes on the back of strong momentum, with a roughly 13 percent 1 month share price return and a near 52 percent year to date share price gain. Long term total shareholder returns above 100 percent hint investors already see Cloetta as a more durable growth and brand story than the recent single digit annual revenue growth might suggest.
If this kind of international brand push has your attention, it could be a good moment to broaden your search and discover fast growing stocks with high insider ownership.
With shares already up sharply and a solid intrinsic discount still implied by fundamentals, the real question now is whether Cloetta remains mispriced value or if the market is simply pulling forward years of growth. Is there still a buying opportunity, or has future expansion been fully priced in?
Price-to-Earnings of 15.5x: Is it justified?
Cloetta trades on a 15.5x price-to-earnings multiple at a last close of SEK38.64, suggesting only a slight premium rather than a bargain.
The price-to-earnings multiple compares what investors pay today with the company’s current earnings. This is a key lens for branded consumer staples where profits matter more than rapid top line growth. For Cloetta, a 15.5x multiple prices in a fairly steady earnings profile and established brands instead of aggressive expansion.
Relative to its own fundamentals, the market looks slightly optimistic. The stock is described as expensive versus a fair price-to-earnings ratio of 14.2x, implying investors are paying up for recent earnings momentum and strong share price performance. That premium could narrow if growth slows toward forecasts or expand if profitability continues to surprise on the upside.
Against peers, the story is more nuanced. Cloetta screens as expensive versus the European Food industry average price-to-earnings of 15.3x, but looks good value compared with a much richer peer average of 25.1x. This highlights how sentiment is split between broader sector norms and a tighter immediate peer set. If the market gravitates back toward the fair ratio, part of today’s valuation premium could unwind.
Explore the SWS fair ratio for Cloetta
Result: Price-to-Earnings of 15.5x (ABOUT RIGHT)
However, Cloetta’s modest revenue growth and declining net income raise the risk that recent valuation strength could reverse if profitability does not re-accelerate.
Find out about the key risks to this Cloetta narrative.
Another Angle on Value
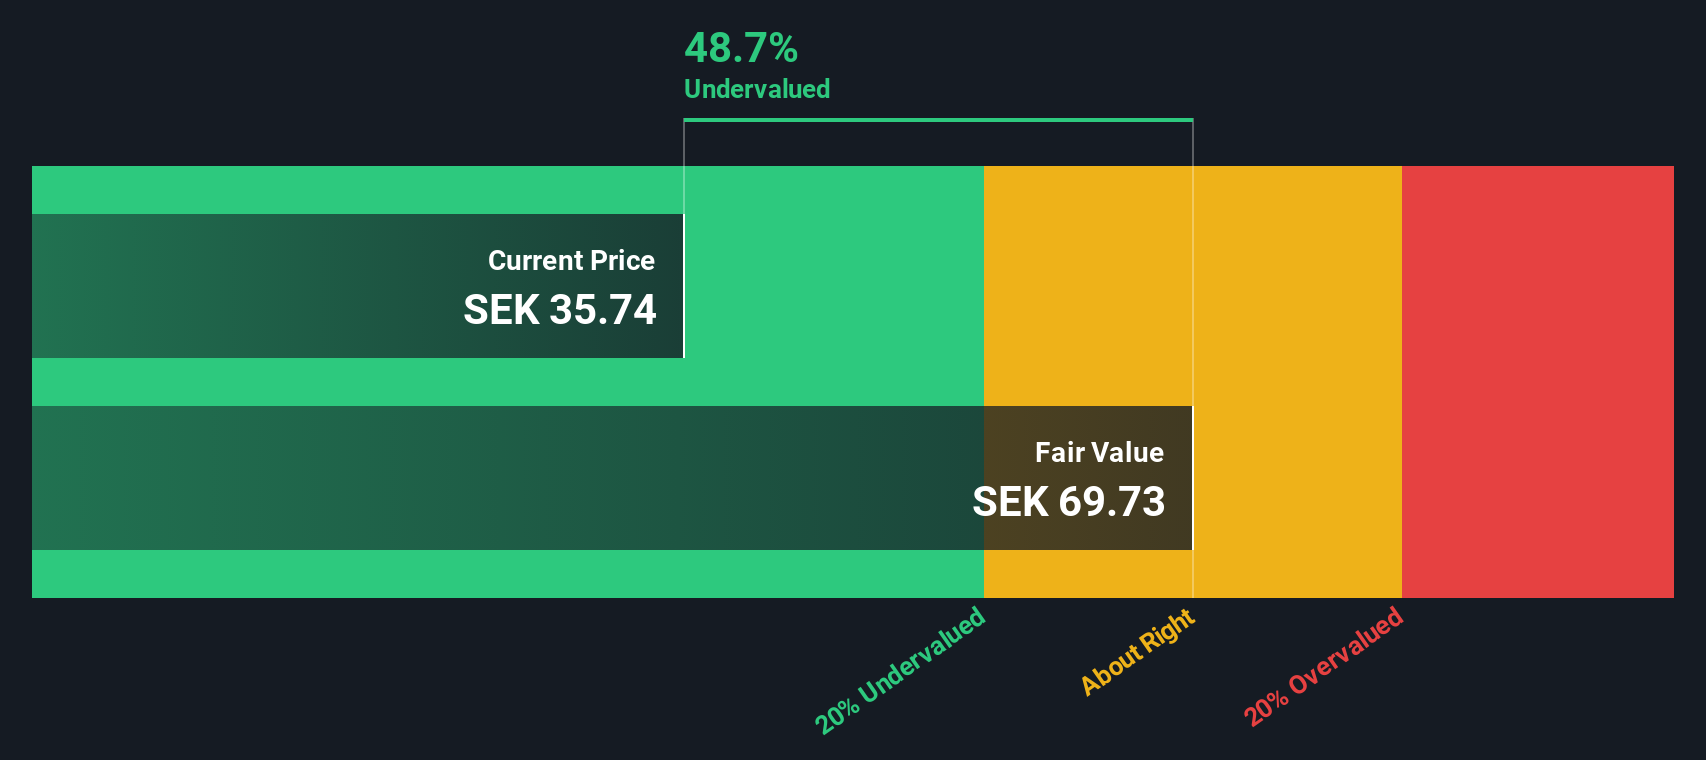
Our SWS DCF model paints a different picture, suggesting Cloetta is trading about 34 percent below its fair value at roughly SEK58.62. If long term cash flows matter more than near term earnings multiples, is the market overlooking a quieter value story here?
Look into how the SWS DCF model arrives at its fair value.
Simply Wall St performs a discounted cash flow (DCF) on every stock in the world every day (check out Cloetta for example). We show the entire calculation in full. You can track the result in your watchlist or portfolio and be alerted when this changes, or use our stock screener to discover 907 undervalued stocks based on their cash flows. If you save a screener we even alert you when new companies match - so you never miss a potential opportunity.
Build Your Own Cloetta Narrative
If you see the story differently, or would rather dig into the numbers yourself, you can build a personalised view in just a few minutes: Do it your way.
A great starting point for your Cloetta research is our analysis highlighting 2 key rewards and 2 important warning signs that could impact your investment decision.
Looking for more investment ideas?
Before you move on, lock in your next potential opportunity with a quick scan of handpicked stock ideas built from proven fundamentals, growth, and income signals.
- Capture mispriced opportunities by running through these 907 undervalued stocks based on cash flows and focusing on businesses where market pessimism contrasts sharply with underlying cash flow strength.
- Tap into structural growth trends by screening these 26 AI penny stocks that are using intelligent automation and machine learning to reshape entire industries.
- Strengthen your income stream by reviewing these 12 dividend stocks with yields > 3% that combine resilient balance sheets with payouts that can meaningfully support long term returns.
This article by Simply Wall St is general in nature. We provide commentary based on historical data and analyst forecasts only using an unbiased methodology and our articles are not intended to be financial advice. It does not constitute a recommendation to buy or sell any stock, and does not take account of your objectives, or your financial situation. We aim to bring you long-term focused analysis driven by fundamental data. Note that our analysis may not factor in the latest price-sensitive company announcements or qualitative material. Simply Wall St has no position in any stocks mentioned.
Have feedback on this article? Concerned about the content? Get in touch with us directly. Alternatively, email editorial-team@simplywallst.com