
 Nasdaq
 華爾街日報
華爾街日報Norion Bank (OM:NORION): Valuation Check After Expanding Share Buyback to Over 5% Treasury Stake
Norion Bank (OM:NORION) just bought back another 2 million shares under its SEK 500 million repurchase program, lifting its treasury stake to over 5% and sharpening the focus on capital allocation.
See our latest analysis for Norion Bank.
The timing of this latest repurchase lines up with solid momentum, with a roughly 79% year to date share price return and a 73% one year total shareholder return suggesting the market is steadily rewarding Norion Bank’s story rather than chasing a short term pop.
If this kind of capital return story has your attention, it can be worth seeing what other banks and lenders are doing with their balance sheets via solid balance sheet and fundamentals stocks screener (None results).
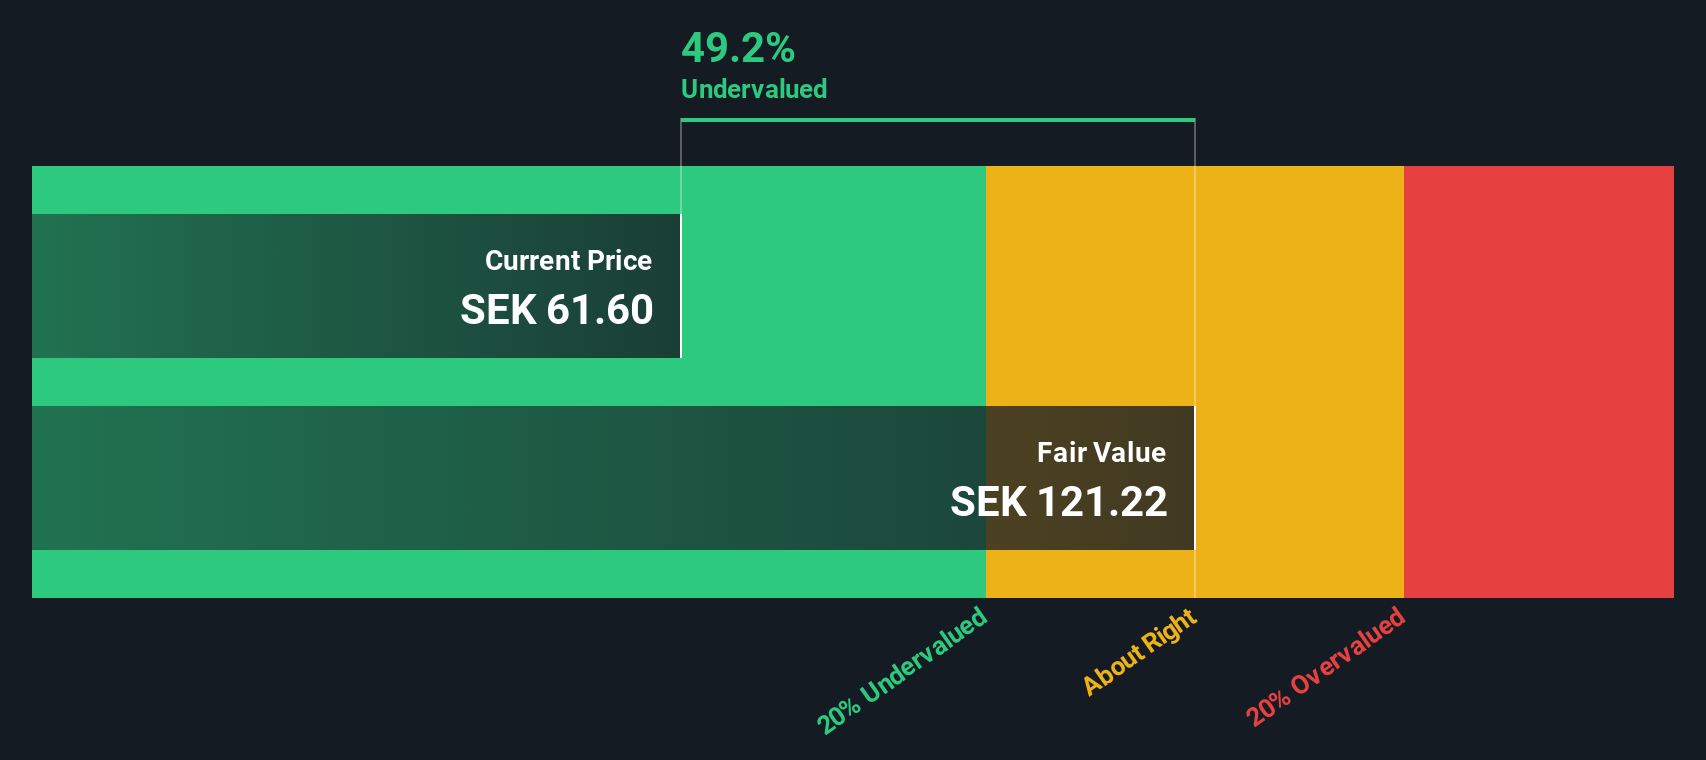
Yet with the shares up sharply this year, but still trading at a hefty discount to some intrinsic value estimates and only a small gap to analyst targets, is this a genuine buying opportunity, or is future growth already priced in?
Price to Earnings of 9.4x: Is it justified?
Norion Bank trades on a price to earnings ratio of 9.4 times at a last close of SEK 68, a level that screens as undervalued against several benchmarks and suggests the market is still cautious despite strong recent returns.
The price to earnings ratio compares a company’s share price to its earnings per share, so for a bank like Norion it is a direct gauge of how much investors are willing to pay for each unit of current profit. In capital intensive, regulated sectors such as banking, this metric is widely used because earnings already incorporate credit losses, funding costs and operating efficiency, making it a useful shorthand for profitability and risk in one figure.
Here, Norion’s 9.4 times multiple stands out as attractive value, with statements indicating the shares trade at good value compared to both peer banks at 13.8 times and the broader European banks industry at 10.4 times. The same analysis suggests that, on a fair price to earnings basis, Norion could justify trading closer to 10.4 times, and that the current discount may leave room for the market to re rate the stock if its earnings trajectory and balance sheet quality remain on track.
On a relative basis, the comparison is stark. Norion’s price to earnings ratio sits well below the 13.8 times peer average and under the 10.4 times industry norm. It also lines up with an estimated fair price to earnings level of 10.4 times that the market could move toward if sentiment improves.
Explore the SWS fair ratio for Norion Bank
Result: Price to Earnings of 9.4x (UNDERVALUED)
However, sustained outperformance is not guaranteed, as slowing net income growth and any credit quality deterioration could potentially undermine the case for further re rating.
Find out about the key risks to this Norion Bank narrative.
Another View: DCF Puts a Much Higher Tag on Norion
While the 9.4 times price to earnings ratio hints at modest undervaluation, our DCF model goes much further, pointing to fair value near SEK 124.83 versus the current SEK 68, a roughly 45% discount. Is the market rightly skeptical, or simply behind the curve?
Look into how the SWS DCF model arrives at its fair value.
Simply Wall St performs a discounted cash flow (DCF) on every stock in the world every day (check out Norion Bank for example). We show the entire calculation in full. You can track the result in your watchlist or portfolio and be alerted when this changes, or use our stock screener to discover 907 undervalued stocks based on their cash flows. If you save a screener we even alert you when new companies match - so you never miss a potential opportunity.
Build Your Own Norion Bank Narrative
If you would rather test the assumptions yourself and draw your own conclusions from the numbers, you can build a tailored view in under three minutes with Do it your way.
A great starting point for your Norion Bank research is our analysis highlighting 4 key rewards and 2 important warning signs that could impact your investment decision.
Looking for your next investing move?
If Norion sparks your interest, do not stop here. Use the Simply Wall Street Screener to uncover more opportunities tailored to your goals and risk appetite.
- Capture mispriced potential with these 907 undervalued stocks based on cash flows that blend solid fundamentals with attractive valuations before the broader market catches on.
- Ride powerful innovation trends by targeting these 26 AI penny stocks positioned to benefit from real world adoption of artificial intelligence across industries.
- Strengthen your income stream through these 12 dividend stocks with yields > 3% offering yields above 3 percent backed by businesses with the capacity to sustain payouts.
This article by Simply Wall St is general in nature. We provide commentary based on historical data and analyst forecasts only using an unbiased methodology and our articles are not intended to be financial advice. It does not constitute a recommendation to buy or sell any stock, and does not take account of your objectives, or your financial situation. We aim to bring you long-term focused analysis driven by fundamental data. Note that our analysis may not factor in the latest price-sensitive company announcements or qualitative material. Simply Wall St has no position in any stocks mentioned.
Have feedback on this article? Concerned about the content? Get in touch with us directly. Alternatively, email editorial-team@simplywallst.com