
 Nasdaq
 華爾街日報
華爾街日報Is It Too Late To Consider Archrock After Its Multi Year Share Price Surge?
- If you are wondering whether Archrock is still a smart buy after its big multi year run, or if most of the upside is already priced in, this breakdown will help you assess whether the current price tag makes sense.
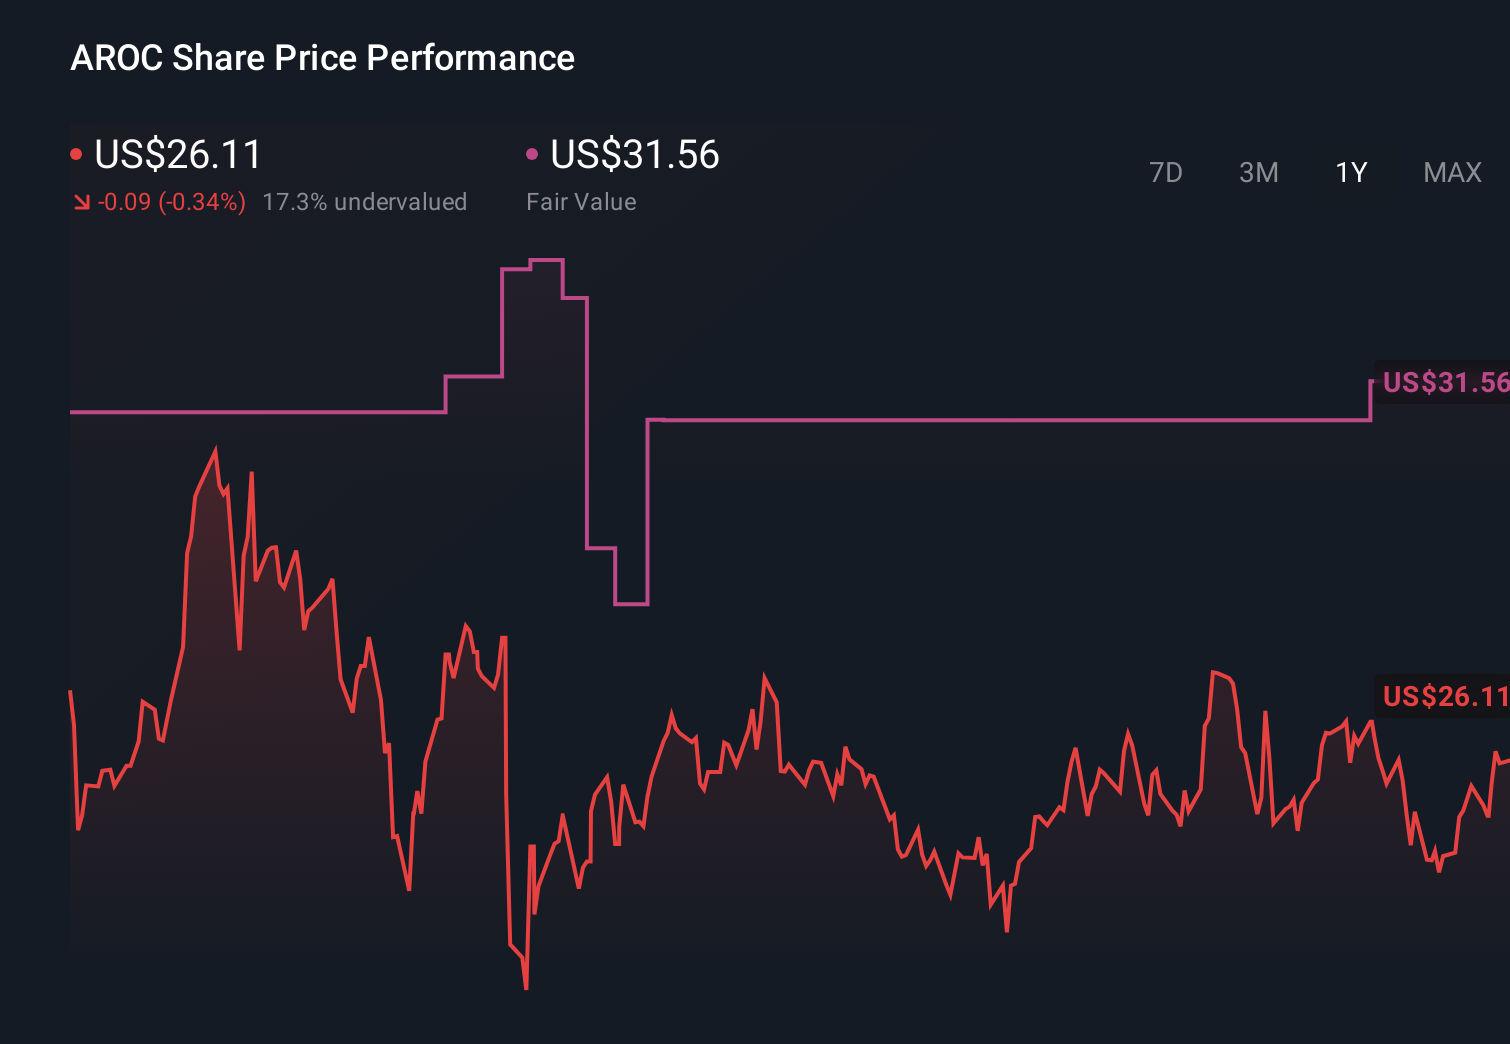
- The stock has inched up 6.2% over the last week and 4.4% over the past month, while longer term holders have seen gains of 254.8% over three years and 277.2% over five years.
- Those moves have come as investors focus on Archrock's role in natural gas infrastructure and the broader push to secure reliable compression capacity across key US basins. Sector tailwinds, contract wins and ongoing demand for midstream services have all contributed to a shift in sentiment toward the stock.
- Right now Archrock scores a 5/6 valuation check, suggesting it screens as undervalued on most of our metrics. Next we walk through how different valuation approaches compare, before finishing with a more complete way to think about what the stock may be worth.
Find out why Archrock's 1.1% return over the last year is lagging behind its peers.
Approach 1: Archrock Discounted Cash Flow (DCF) Analysis
A Discounted Cash Flow model estimates what a company is worth today by projecting its future cash flows and discounting them back to their present value. For Archrock, this approach uses forecast Free Cash Flow to Equity as the key input.
Archrock generated around $60 million of free cash flow over the last twelve months, and analysts expect this to rise sharply as compression demand grows. Simply Wall St combines analyst forecasts with its own extrapolations, projecting free cash flow to reach roughly $557.7 million by 2035, with intermediate steps such as $286.2 million in 2026 and $414 million in 2029, all in dollars.
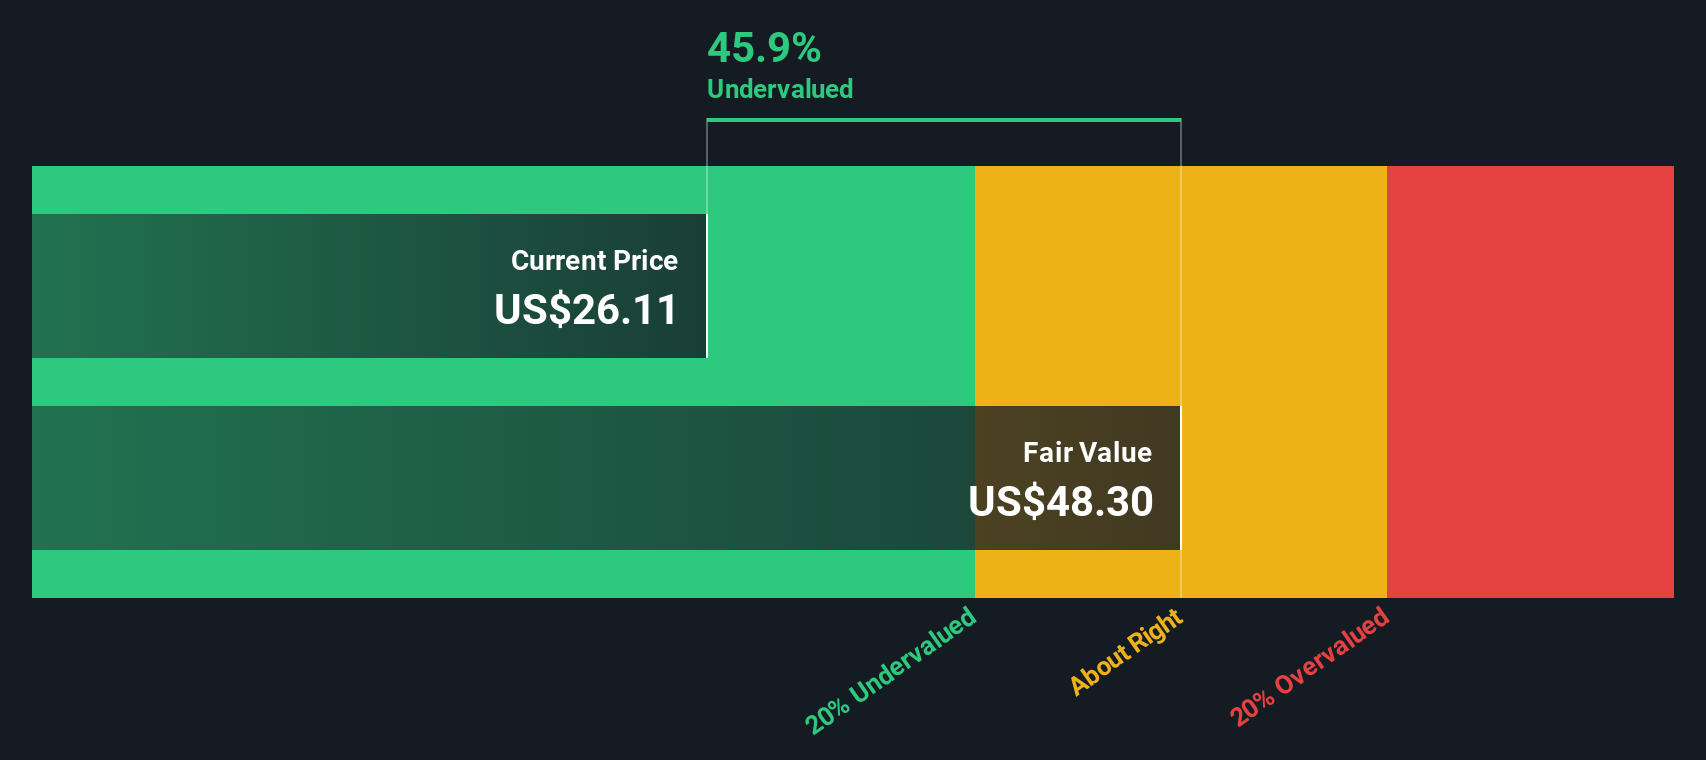
Using a 2 Stage Free Cash Flow to Equity model, these projected cash flows are discounted back to today, resulting in an estimated intrinsic value of about $47.79 per share. That implies the stock trades at roughly a 45.4% discount to its DCF fair value, indicating notable upside if these projections prove accurate.
Result: UNDERVALUED
Our Discounted Cash Flow (DCF) analysis suggests Archrock is undervalued by 45.4%. Track this in your watchlist or portfolio, or discover 907 more undervalued stocks based on cash flows.
Approach 2: Archrock Price vs Earnings
For profitable companies like Archrock, the price to earnings multiple is a useful way to gauge value because it links what investors pay today directly to the profits the business is generating. In general, higher expected growth and lower perceived risk justify a higher normal PE ratio, while slower growth or higher uncertainty tend to pull that fair range down.
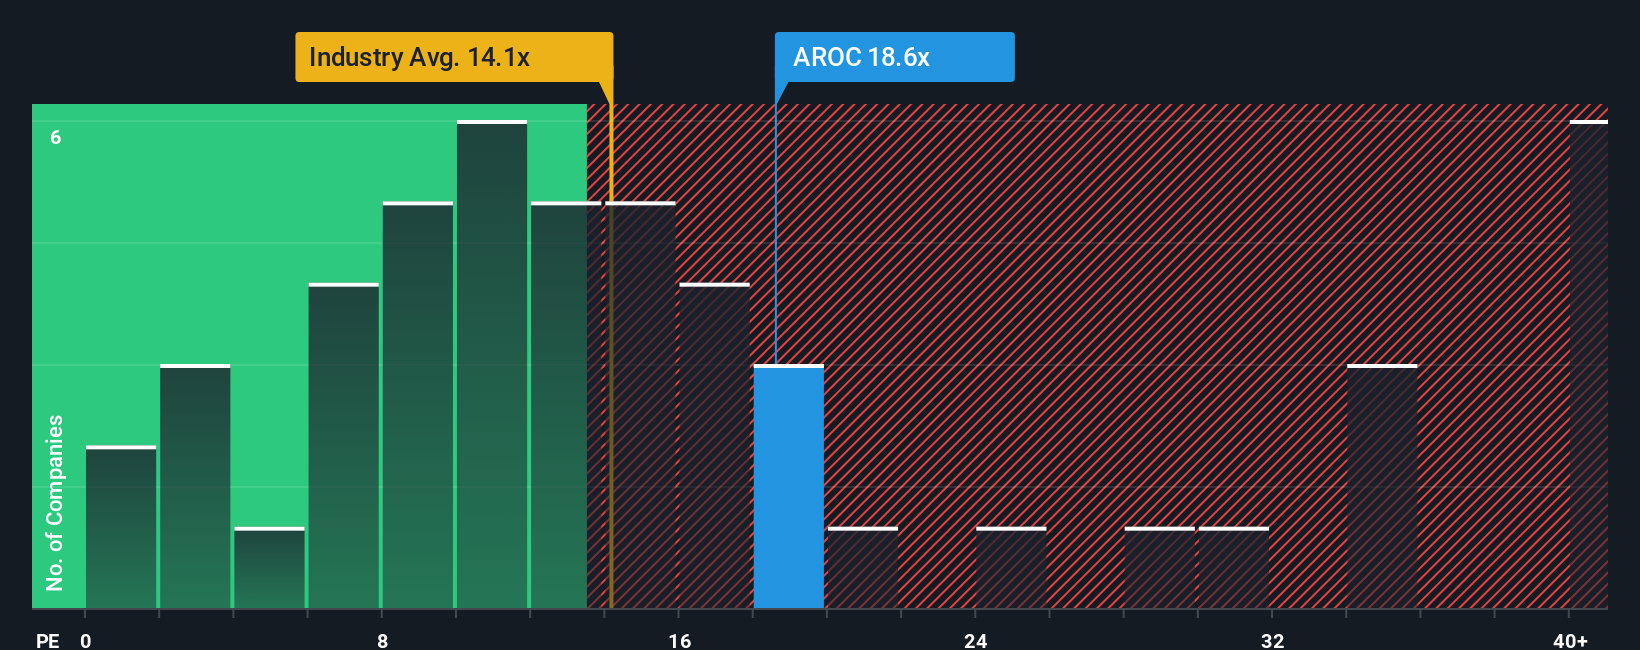
Archrock currently trades at about 17.45x earnings, which is slightly below the Energy Services industry average of roughly 18.67x and well below the peer group average of around 37.38x. Simply Wall St also calculates a Fair Ratio of 17.36x for Archrock, which is a proprietary view of what its PE should be once its earnings growth profile, profitability, industry, market cap and risk characteristics are factored in. This Fair Ratio is more tailored than a simple industry or peer comparison because it adjusts for company specific strengths and risks rather than relying on broad averages.
With the current PE of 17.45x sitting almost exactly in line with the 17.36x Fair Ratio, the market appears to be pricing Archrock efficiently on this metric.
Result: ABOUT RIGHT
PE ratios tell one story, but what if the real opportunity lies elsewhere? Discover 1446 companies where insiders are betting big on explosive growth.
Upgrade Your Decision Making: Choose your Archrock Narrative
Earlier we mentioned that there is an even better way to understand valuation, so let us introduce you to Narratives, a simple tool that lets you attach a story, your view on Archrock’s future revenue, earnings and margins, to the numbers you see on screen.
A Narrative connects three pieces together in one place: the company’s story, a financial forecast based on that story, and the resulting fair value estimate for the stock.
On Simply Wall St’s Community page, used by millions of investors, Narratives make this process easy and accessible by guiding you through your assumptions so you can compare your Fair Value to today’s Price to decide whether Archrock looks like a buy, a hold, or a sell.
Because Narratives update dynamically as new news, earnings and guidance come in, your fair value view can stay current instead of quickly going stale.
For example, one investor might build a bullish Archrock Narrative around buybacks, steady 7.1% revenue growth, rising 21.5% margins and an 18.3x future PE to justify a fair value near 31.6 dollars. A more cautious investor could plug in weaker growth, lower margins and a smaller multiple to arrive at a much lower fair value and a very different decision.
Do you think there's more to the story for Archrock? Head over to our Community to see what others are saying!
This article by Simply Wall St is general in nature. We provide commentary based on historical data and analyst forecasts only using an unbiased methodology and our articles are not intended to be financial advice. It does not constitute a recommendation to buy or sell any stock, and does not take account of your objectives, or your financial situation. We aim to bring you long-term focused analysis driven by fundamental data. Note that our analysis may not factor in the latest price-sensitive company announcements or qualitative material. Simply Wall St has no position in any stocks mentioned.
Have feedback on this article? Concerned about the content? Get in touch with us directly. Alternatively, email editorial-team@simplywallst.com