
 Nasdaq
 華爾街日報
華爾街日報Is Ouster’s 108% Surge in 2025 Supported by Its Cash Flow Outlook?
- Wondering if Ouster's huge run means you are late to the party or staring at an overlooked opportunity? Let's break down what the market is really pricing in here.
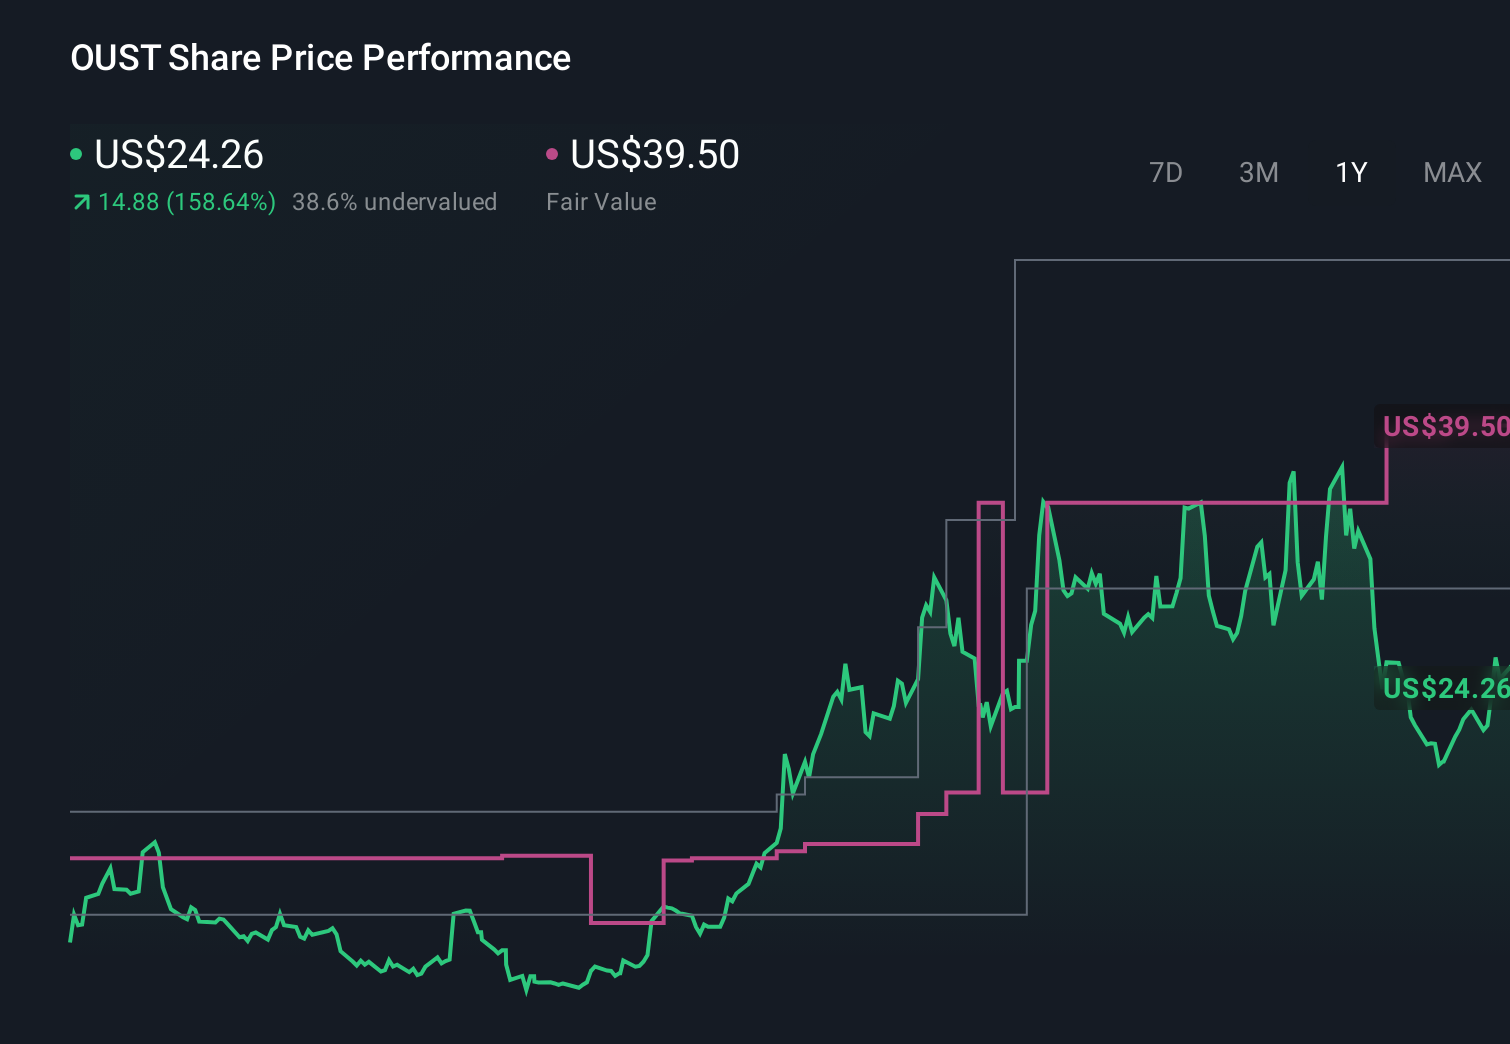
- The stock is up 108.3% year to date and 181.4% over the last year, even after a recent 1.0% dip over 7 days and a modest 3.7% gain across 30 days. This hints that sentiment has shifted fast, and risk perceptions are clearly changing.
- Much of this excitement has been driven by Ouster's push to scale its lidar technology into automotive, industrial, and smart infrastructure markets, alongside ongoing consolidation and partnership chatter in the sector that keeps investors watching closely. Broader interest in autonomy and sensor plays has also helped re rate the whole space, giving stocks like Ouster a stronger tailwind than they had just a couple of years ago.
- Despite that surge, Ouster only scores a 4/6 valuation check, suggesting it may still be undervalued on several key metrics. Next, we will unpack the main valuation approaches analysts use and then finish with a more nuanced way to think about what Ouster might truly be worth.
Approach 1: Ouster Discounted Cash Flow (DCF) Analysis
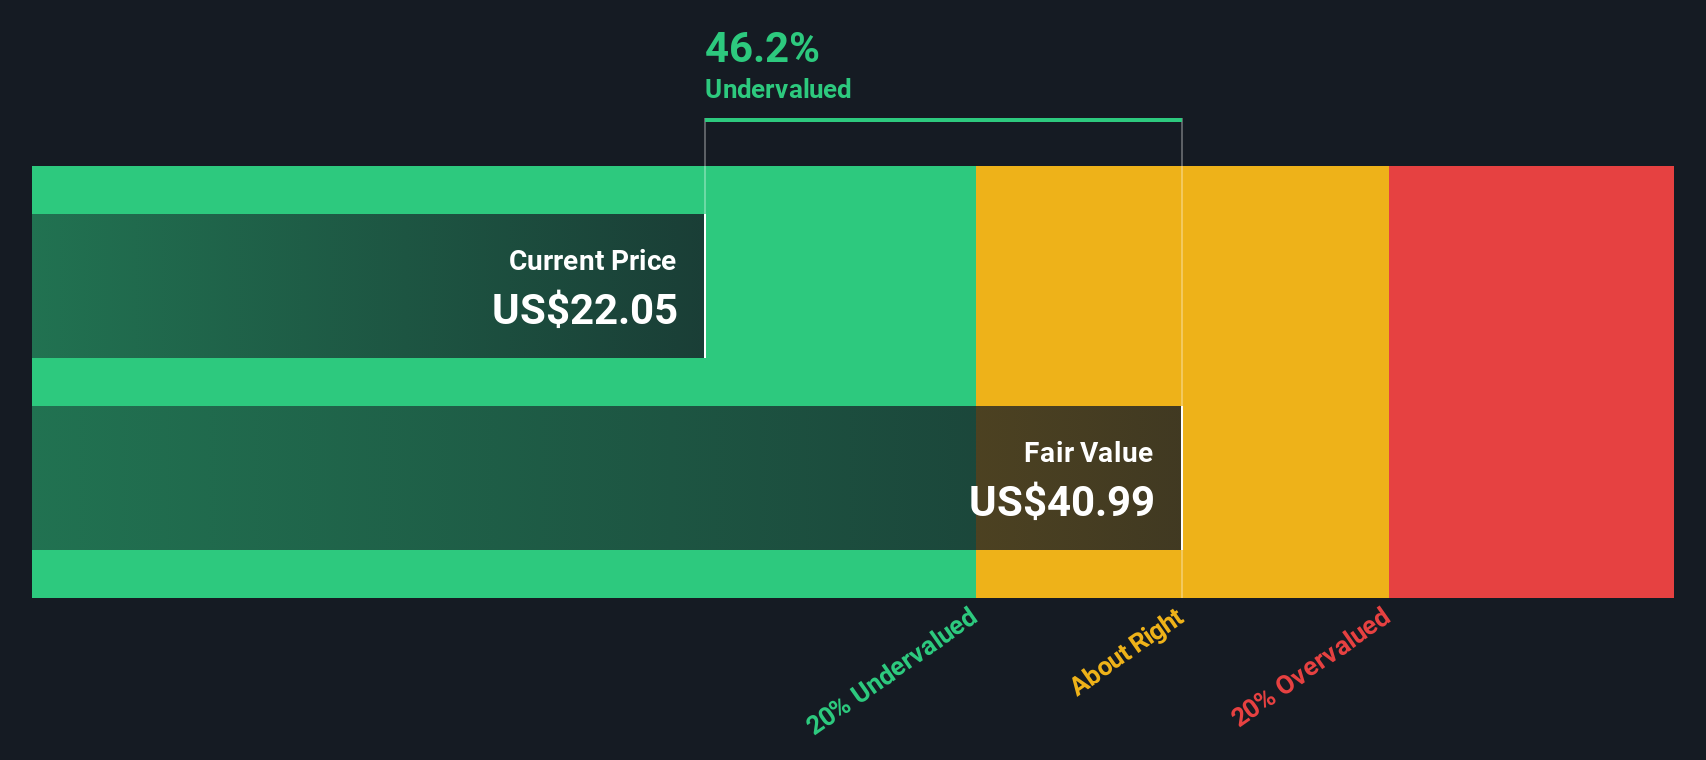
A Discounted Cash Flow model estimates what a company is worth by projecting its future cash flows and then discounting them back to today in $ terms. For Ouster, the model starts from last twelve months free cash flow of about $32.8 Million in the red, reflecting a business still investing heavily for growth.
Analysts expect free cash flow to turn positive and scale meaningfully, with projections reaching $62.9 Million by 2029 and extrapolated out a further six years using Simply Wall St assumptions. Over 2026 to 2035, free cash flow is modeled to climb from roughly negative $25.9 Million to about $214.8 Million, highlighting a steep improvement in profitability as lidar adoption grows.
Discounting these cash flows using a 2 Stage Free Cash Flow to Equity model yields an estimated intrinsic value of about $40.87 per share. With the DCF implying the stock is trading at a 37.1% discount to this value, Ouster appears materially undervalued on cash flow grounds.
Result: UNDERVALUED
Our Discounted Cash Flow (DCF) analysis suggests Ouster is undervalued by 37.1%. Track this in your watchlist or portfolio, or discover 908 more undervalued stocks based on cash flows.
Approach 2: Ouster Price vs Sales
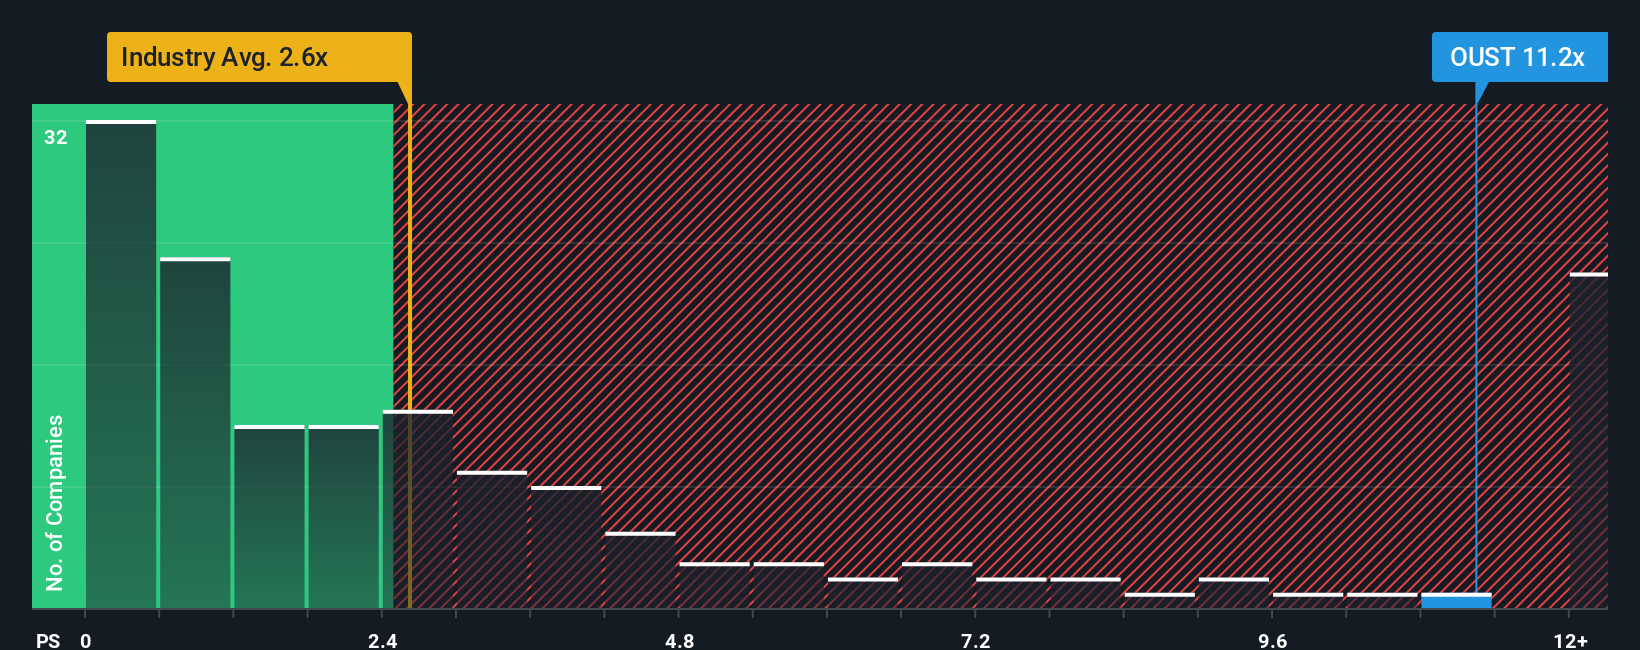
For companies like Ouster that are not yet consistently profitable, the Price to Sales ratio is often the cleanest way to compare valuation, because it focuses on how much investors are paying for each dollar of revenue rather than uncertain earnings.
In general, higher growth and lower risk justify a richer multiple. Slower or more volatile businesses tend to trade at lower Price to Sales ratios. Ouster currently trades on about 11.24x sales, well above the Electronic industry average of roughly 2.54x and still below the peer group average of around 20.22x. This reflects the market’s expectations for rapid growth in lidar deployments.
Simply Wall St’s Fair Ratio framework goes a step further. It estimates what Ouster’s Price to Sales multiple should be based on its growth outlook, profitability trajectory, risk profile, industry and market cap. This model suggests a Fair Ratio of about 4.06x, implying the current 11.24x multiple is richer than what those fundamentals support and that Ouster looks overvalued on a sales basis.
Result: OVERVALUED
PS ratios tell one story, but what if the real opportunity lies elsewhere? Discover 1446 companies where insiders are betting big on explosive growth.
Upgrade Your Decision Making: Choose your Ouster Narrative
Earlier we mentioned that there is an even better way to understand valuation, so let's introduce you to Narratives. These are simple stories investors build on Simply Wall St's Community page to connect their view of a company like Ouster with specific forecasts for future revenue, earnings, margins and a resulting fair value. This fair value can be compared to today’s price to help decide whether to buy, hold or sell. Narratives automatically update as new news or earnings arrive so your thesis is always current. For example, one investor might create a bullish Ouster Narrative that leans toward the upper end of analyst expectations with a fair value closer to about $50, because they believe Department of Defense certification and intelligent transportation expansion will drive rapid adoption and margin expansion. A more cautious investor could build a conservative Narrative anchored nearer $30, assuming tougher competition and lumpier government demand. Yet both are using the same structured tool to translate their story into numbers and a live, dynamic fair value signal they can track over time.
Do you think there's more to the story for Ouster? Head over to our Community to see what others are saying!
This article by Simply Wall St is general in nature. We provide commentary based on historical data and analyst forecasts only using an unbiased methodology and our articles are not intended to be financial advice. It does not constitute a recommendation to buy or sell any stock, and does not take account of your objectives, or your financial situation. We aim to bring you long-term focused analysis driven by fundamental data. Note that our analysis may not factor in the latest price-sensitive company announcements or qualitative material. Simply Wall St has no position in any stocks mentioned.
Have feedback on this article? Concerned about the content? Get in touch with us directly. Alternatively, email editorial-team@simplywallst.com