
 Nasdaq
 華爾街日報
華爾街日報Does Lennar’s Share Price Pullback Signal an Opportunity for Long Term Investors?
- Wondering if Lennar is a bargain or a value trap at current levels? You are not alone. Homeowners, investors, and even competitors are all watching this builder closely as the housing cycle evolves.
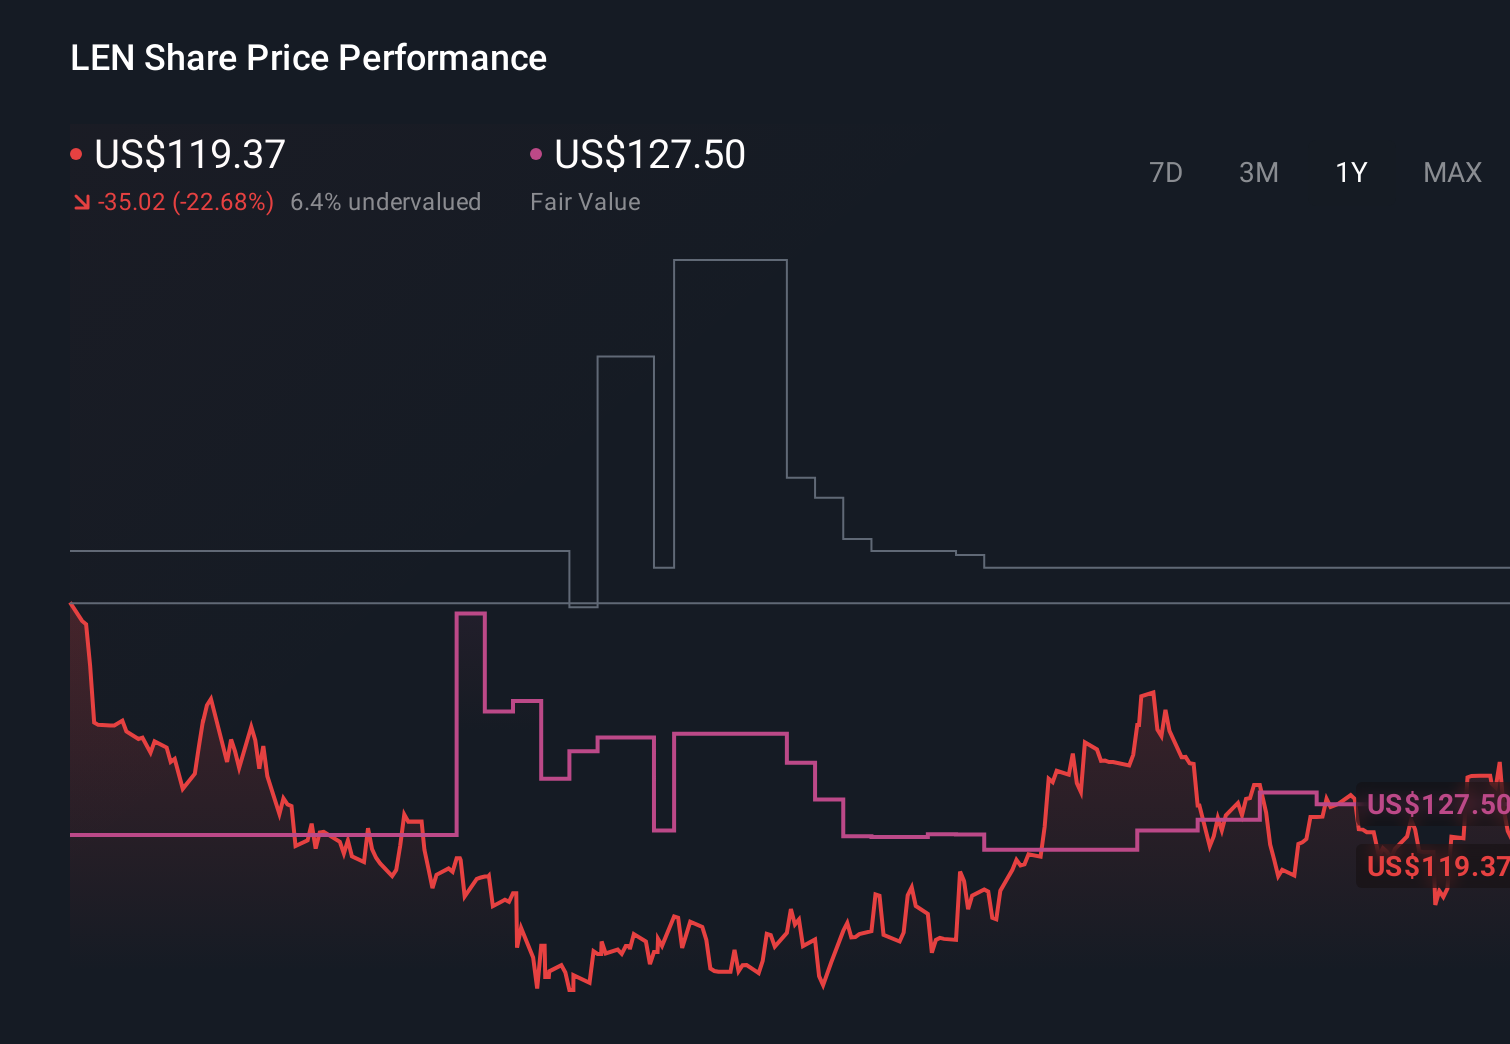
- The stock has pulled back recently, with shares down about 9.8% over the last week and 10.7% year to date, even though the 3 year and 5 year returns are still a strong 49.3% and 87.9% respectively. This hints that the market might be rethinking the risk and reward balance.
- Recent headlines have centered on shifts in mortgage rates, changing housing affordability, and ongoing debate about whether US housing demand can stay resilient despite tighter financial conditions. All of these factors directly affect sentiment toward big homebuilders like Lennar. Investors have also been weighing policy discussions around housing supply initiatives and zoning reform, which could reshape long term demand and pricing power across the sector.
- Right now, Lennar scores a solid 5/6 on our valuation checks, suggesting it screens as undervalued on most of the metrics that matter. Next, we will dig into what different valuation approaches are saying about the stock, before looking at an even more powerful way to think about its true worth by the end of this article.
Find out why Lennar's -16.5% return over the last year is lagging behind its peers.
Approach 1: Lennar Discounted Cash Flow (DCF) Analysis
A Discounted Cash Flow, or DCF, model estimates what a company is worth today by projecting its future cash flows and discounting them back to the present. For Lennar, the model uses a 2 Stage Free Cash Flow to Equity approach, drawing on analyst forecasts for the next few years and then extrapolating longer term trends.
While Lennar has reported last twelve month free cash flow of around negative $0.70 billion, the model assumes a recovery and growth path, with free cash flow projected to reach roughly $3.70 billion by 2035 in $. These projections are built from analyst estimates through 2027, then extended by Simply Wall St using gradually slowing growth rates over the following years.
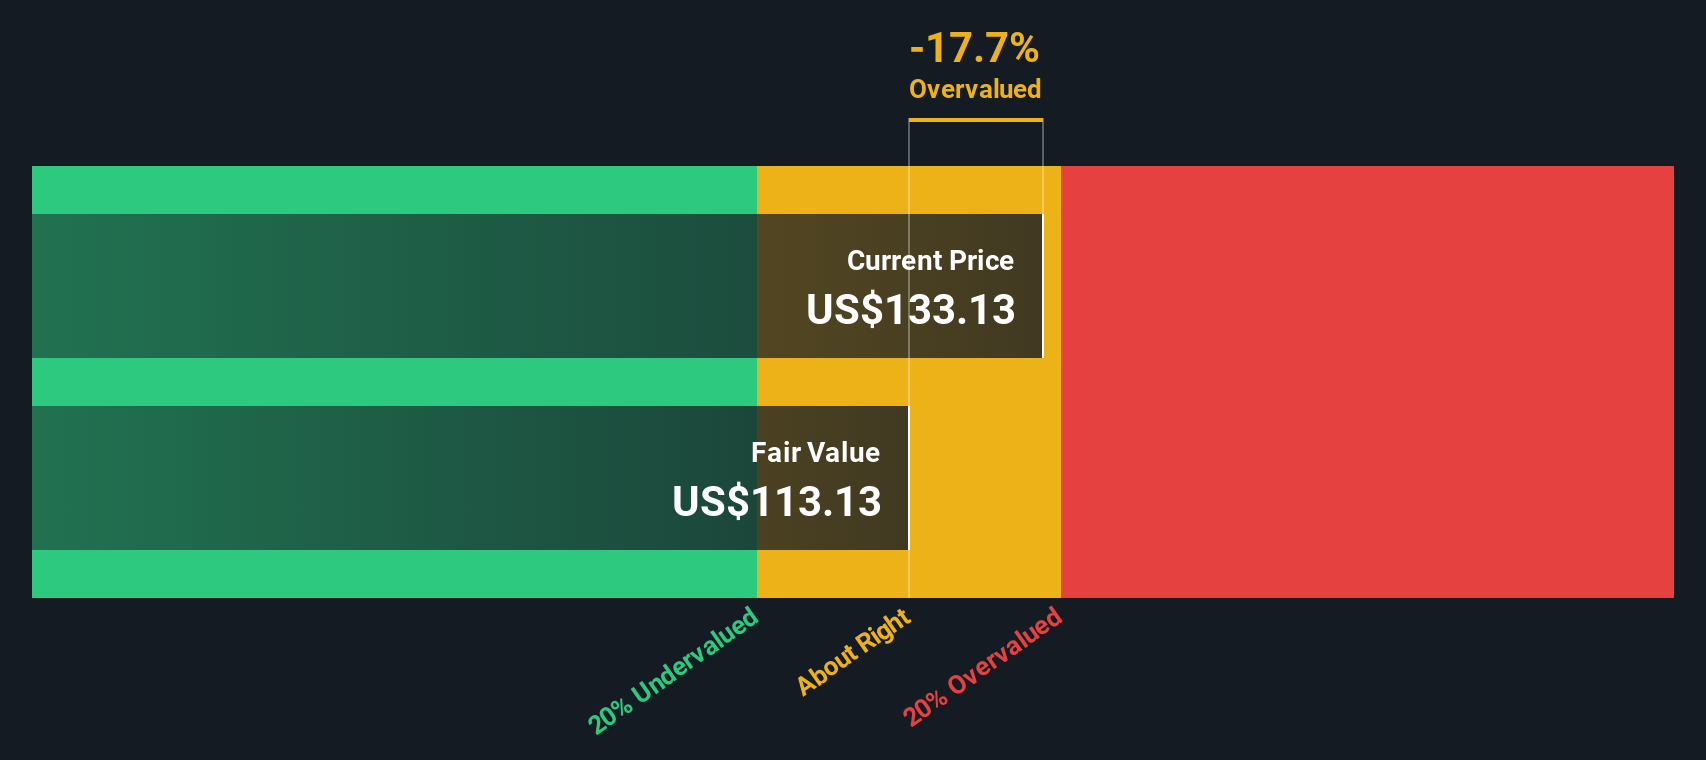
Bringing those projected cash flows back to today, the DCF model arrives at an intrinsic value of about $189.24 per share, implying the stock is trading at roughly a 36.6% discount. On this basis, the current price suggests potential upside if these cash flow assumptions hold.
Result: UNDERVALUED
Our Discounted Cash Flow (DCF) analysis suggests Lennar is undervalued by 36.6%. Track this in your watchlist or portfolio, or discover 908 more undervalued stocks based on cash flows.
Approach 2: Lennar Price vs Earnings
For a profitable company like Lennar, the Price to Earnings, or PE, ratio is a practical way to gauge whether investors are paying a reasonable price for each dollar of current earnings. In general, faster expected growth and lower perceived risk justify a higher, normal PE, while slower growth or higher uncertainty call for a lower multiple.
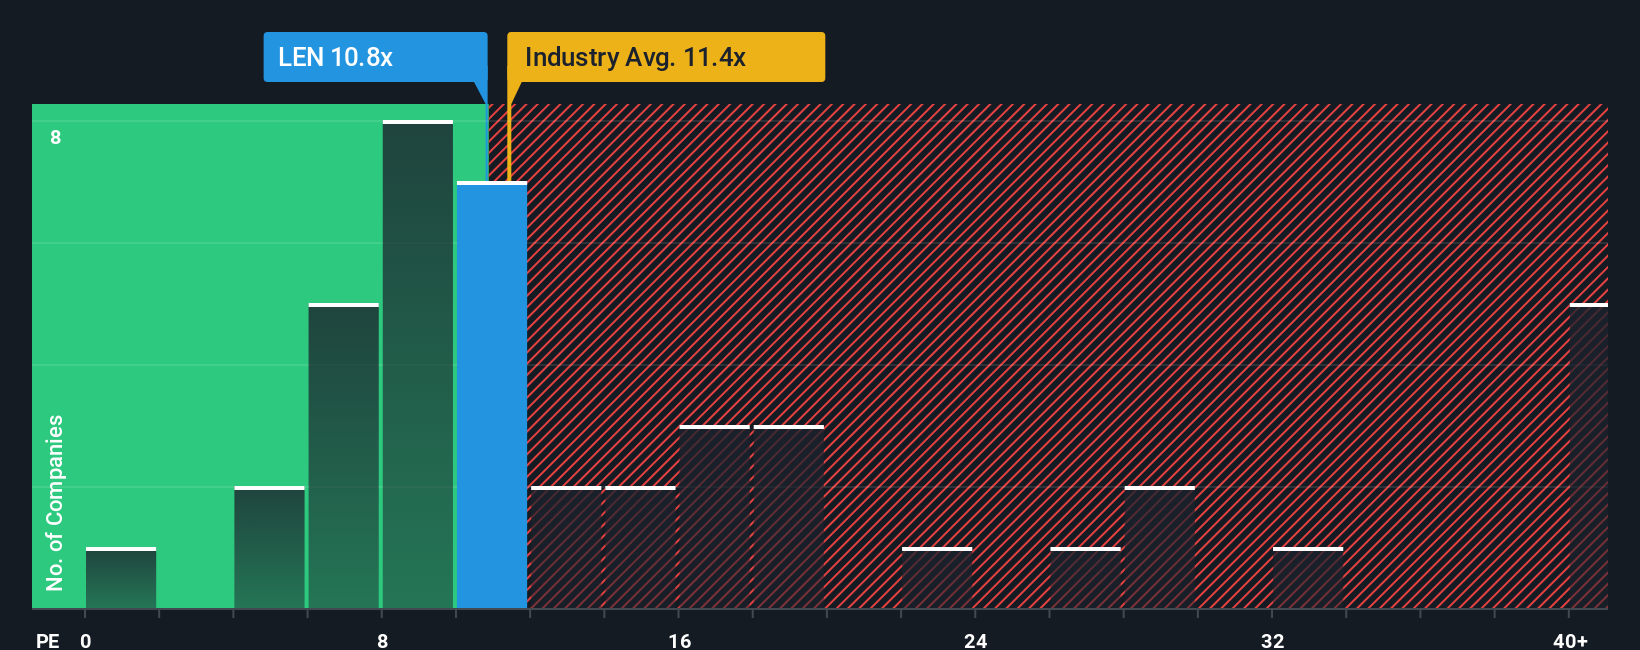
Lennar currently trades on a PE of about 11.16x, which sits close to both the Consumer Durables industry average of around 11.19x and the peer group average of roughly 11.69x. On this simple comparison, the market is valuing Lennar broadly in line with its sector and competitors rather than awarding a significant premium or discount.
Simply Wall St goes a step further by estimating a Fair Ratio of 17.37x for Lennar. This is a proprietary view of what the PE should be once factors like earnings growth prospects, profit margins, industry dynamics, market cap and company specific risks are all accounted for. This makes Fair Ratio more informative than basic peer or industry comparisons, which often miss these nuances. With the Fair Ratio well above the current 11.16x, the multiple analysis points to Lennar being undervalued on earnings.
Result: UNDERVALUED
PE ratios tell one story, but what if the real opportunity lies elsewhere? Discover 1446 companies where insiders are betting big on explosive growth.
Upgrade Your Decision Making: Choose your Lennar Narrative
Earlier we mentioned that there is an even better way to understand valuation, so let us introduce you to Narratives, a simple way to connect your view of Lennar’s story with a concrete forecast and fair value. A Narrative is your own explanation of what you think will happen to a company’s revenue, earnings and margins, and how that should translate into a fair value per share, rather than just accepting a single static target. On Simply Wall St’s Community page, millions of investors use Narratives as an easy, accessible tool to lay out their assumptions, turn them into forward financials, and compare the resulting Fair Value to today’s Price to decide whether to buy, hold or sell. Because Narratives on the platform are updated dynamically as new news, earnings or macro data comes in, your fair value can evolve with the story instead of going stale. For Lennar, for example, some investors currently see fair value closer to about $162 per share while others are nearer $128, reflecting different beliefs about housing demand, margins and the right PE multiple. Narratives make these differences transparent and testable.
Do you think there's more to the story for Lennar? Head over to our Community to see what others are saying!
This article by Simply Wall St is general in nature. We provide commentary based on historical data and analyst forecasts only using an unbiased methodology and our articles are not intended to be financial advice. It does not constitute a recommendation to buy or sell any stock, and does not take account of your objectives, or your financial situation. We aim to bring you long-term focused analysis driven by fundamental data. Note that our analysis may not factor in the latest price-sensitive company announcements or qualitative material. Simply Wall St has no position in any stocks mentioned.
Have feedback on this article? Concerned about the content? Get in touch with us directly. Alternatively, email editorial-team@simplywallst.com