
 Nasdaq
 華爾街日報
華爾街日報Has Samsara’s Recent 15% Surge Pushed Its Valuation Beyond Future Cash Flow Prospects?
- Wondering if Samsara at around $45 is still a smart buy or if the easy money has already been made? You are not alone. This stock divides opinion on whether the current price matches its real long term potential.
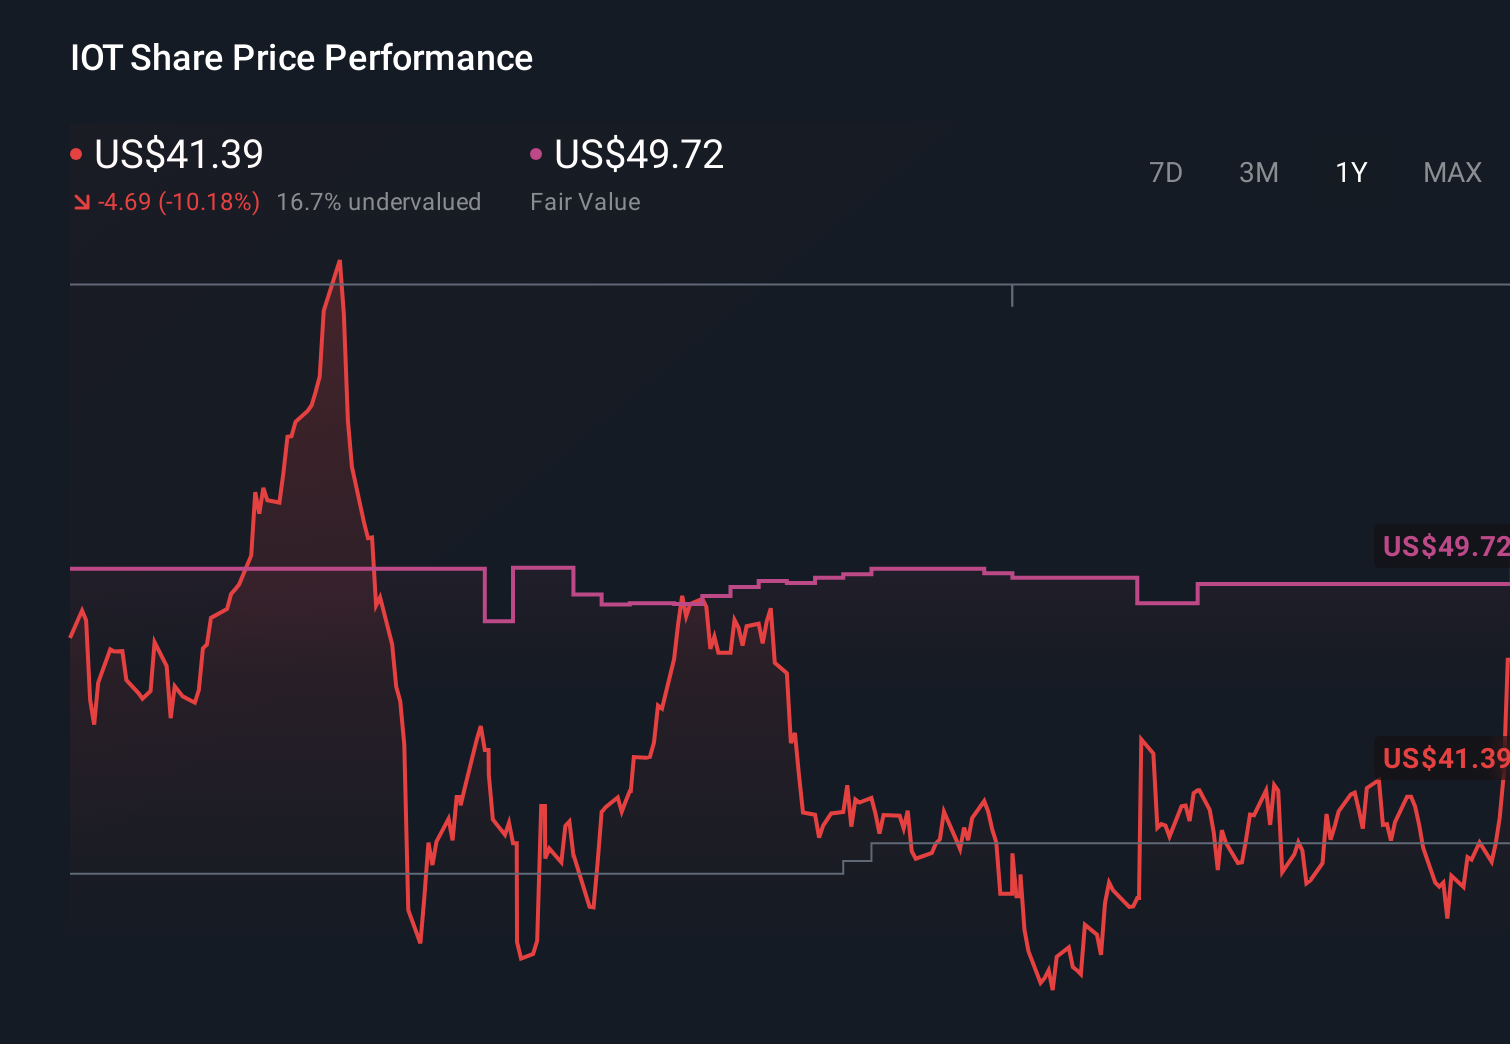
- Over the last week Samsara is up 15.4%, adding to a 13.0% gain over the past month. That compares with a modest 2.3% gain year to date and a slightly negative 1 year return of -3.0% after a 3 year climb of 233.7%.
- Part of this volatility reflects how investors are reassessing high growth, software heavy names like Samsara as interest rate expectations shift and sentiment rotates between risk on and risk off. At the same time, ongoing enthusiasm around AI enabled efficiency tools and connected operations platforms has kept Samsara on the radar of growth focused investors who are looking beyond short term swings.
- Despite that backdrop, Samsara currently scores just 0/6 on our valuation checks, suggesting it does not screen as undervalued on a traditional basis. In the rest of this article we will walk through those valuation methods and outline a more nuanced way to judge what the market might be missing.
Samsara scores just 0/6 on our valuation checks. See what other red flags we found in the full valuation breakdown.
Approach 1: Samsara Discounted Cash Flow (DCF) Analysis
A Discounted Cash Flow model estimates what a business is worth by projecting the cash it can generate in the future and discounting those cash flows back to today in dollar terms.
For Samsara, the model starts with last twelve month Free Cash Flow of about $195.6 million and uses analyst forecasts plus extrapolated estimates to project strong growth. By 2030, Free Cash Flow is expected to reach roughly $869.9 million, with intermediate years stepping up from just over $200 million in 2026 to more than $1.6 billion by 2035 as the business scales.
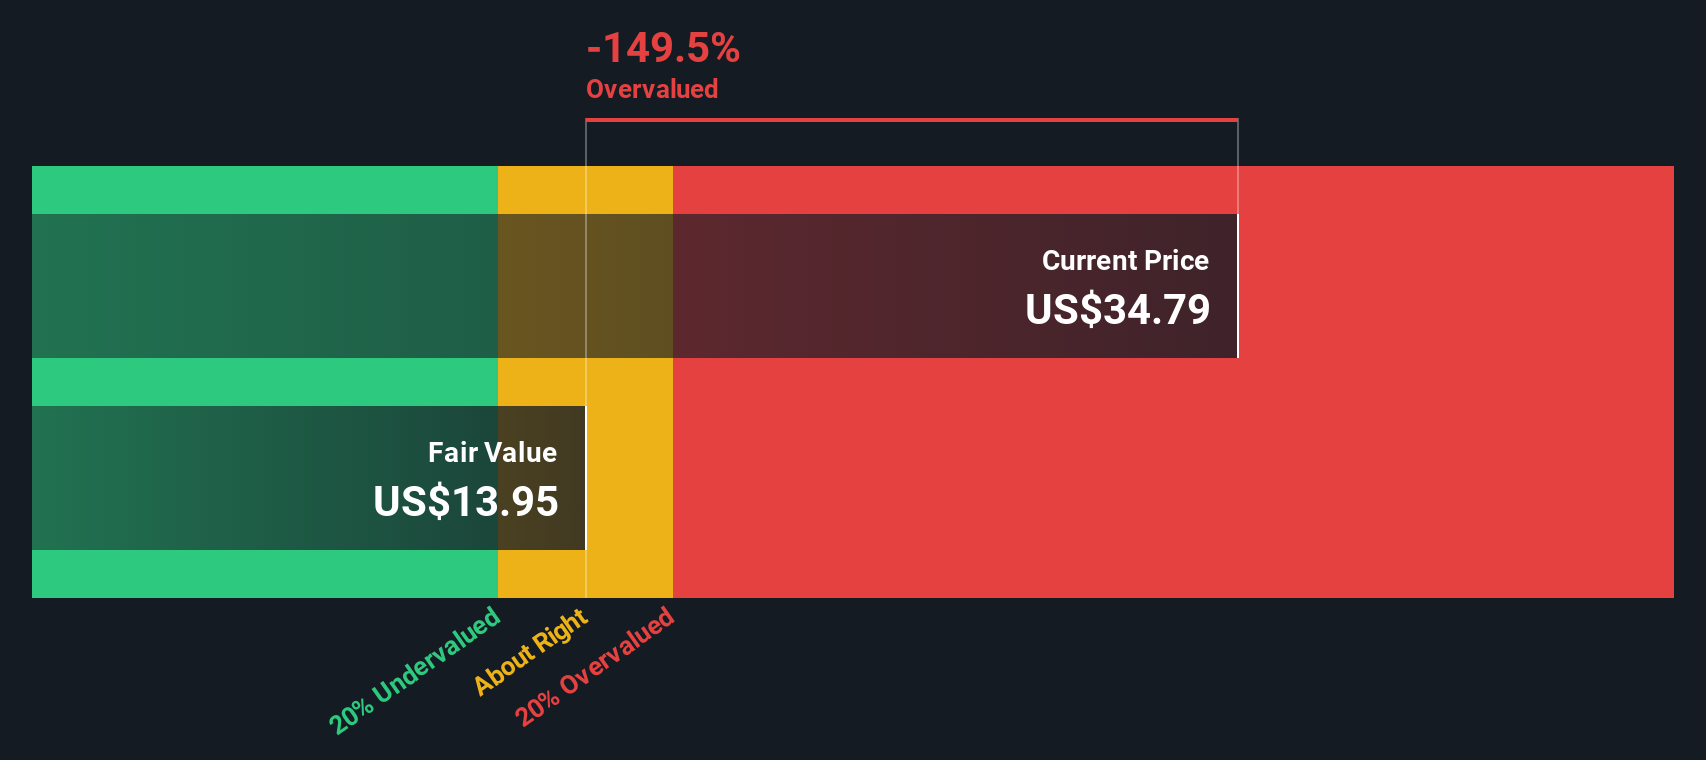
Using a 2 Stage Free Cash Flow to Equity approach, Simply Wall St’s DCF model arrives at an estimated intrinsic value of $33.39 per share. Versus a market price around $45, this implies Samsara is about 34.8% overvalued on cash flow fundamentals.
In other words, the market is already pricing in a very optimistic growth path, which leaves less margin of safety for new investors.
Result: OVERVALUED
Our Discounted Cash Flow (DCF) analysis suggests Samsara may be overvalued by 34.8%. Discover 908 undervalued stocks or create your own screener to find better value opportunities.
Approach 2: Samsara Price vs Sales
For high growth software businesses that are not yet valued on steady earnings, the Price to Sales multiple is often the cleanest way to gauge what investors are willing to pay for each dollar of revenue. It reflects both how quickly sales are growing and how confident the market is that those sales will eventually translate into durable profits.
In general, faster growth and lower perceived risk justify a higher multiple, while slower growth or greater uncertainty should pull the multiple closer to, or below, sector norms. Samsara currently trades on a Price to Sales ratio of about 17.08x, which is well above the broader Software industry average of around 5.06x and also richer than the peer group average near 9.14x. Simply Wall St’s proprietary Fair Ratio framework estimates what a reasonable Price to Sales multiple should be, given Samsara’s growth profile, margins, scale and risk, and arrives at a Fair Ratio of roughly 10.51x.
Because this Fair Ratio is materially lower than the current 17.08x, the shares look expensive even after adjusting for Samsara’s attractive growth story.
Result: OVERVALUED
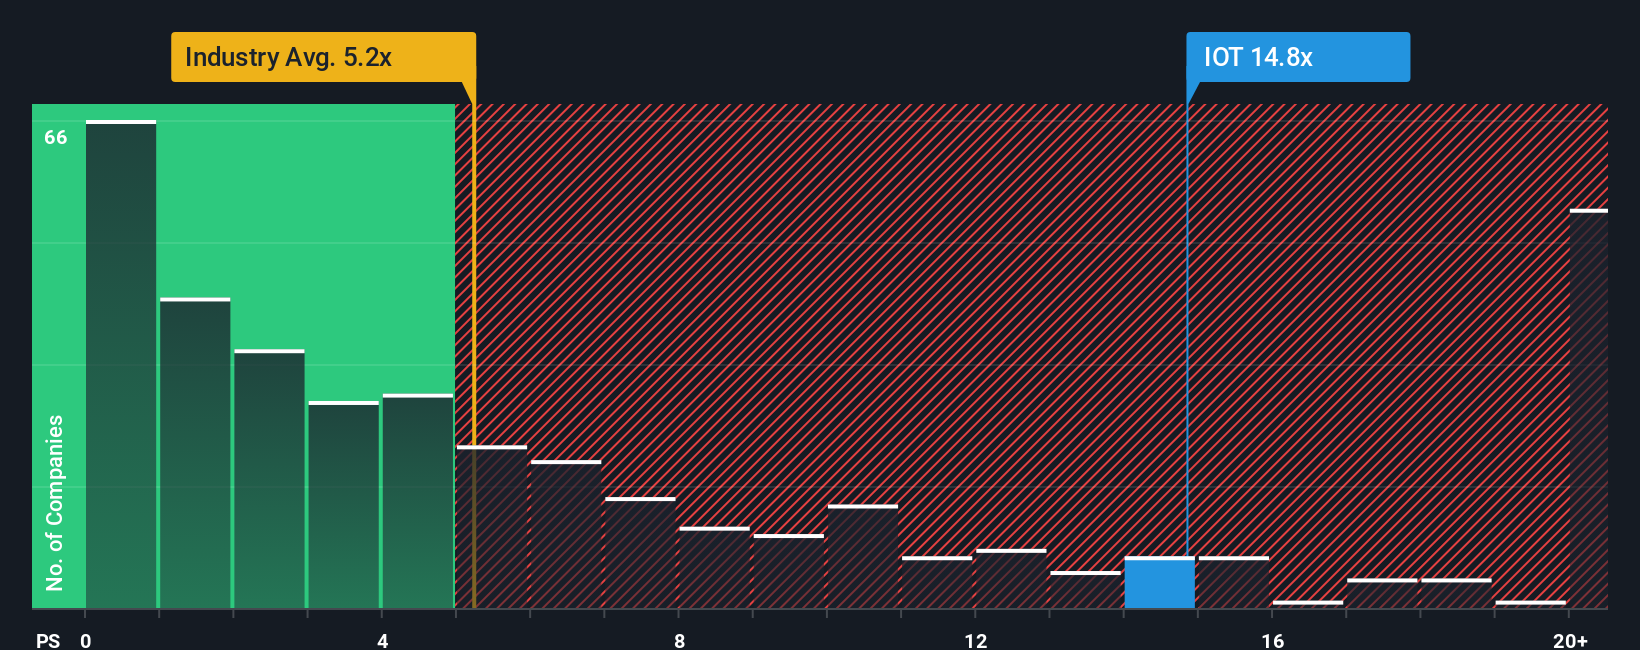
PS ratios tell one story, but what if the real opportunity lies elsewhere? Discover 1446 companies where insiders are betting big on explosive growth.
Upgrade Your Decision Making: Choose your Samsara Narrative
Earlier we mentioned that there is an even better way to understand valuation, so let us introduce you to Narratives, a simple tool on Simply Wall St’s Community page that lets you connect your view of Samsara’s story to a set of assumptions about future revenue, earnings and margins. It then automatically translates that into a Fair Value you can compare with today’s price to decide whether to buy, hold or sell. The platform keeps your Narrative up to date as new earnings, news or guidance arrives and different investors express their perspectives. For example, one optimistic Samsara Narrative might see AI features, ARR momentum and a huge under penetrated market supporting a Fair Value near $60. A more cautious Narrative might focus on patent risks, competition and long sales cycles and land closer to $38. This shows how the same information can underpin very different, but clearly structured, investment decisions.
Do you think there's more to the story for Samsara? Head over to our Community to see what others are saying!
This article by Simply Wall St is general in nature. We provide commentary based on historical data and analyst forecasts only using an unbiased methodology and our articles are not intended to be financial advice. It does not constitute a recommendation to buy or sell any stock, and does not take account of your objectives, or your financial situation. We aim to bring you long-term focused analysis driven by fundamental data. Note that our analysis may not factor in the latest price-sensitive company announcements or qualitative material. Simply Wall St has no position in any stocks mentioned.
Have feedback on this article? Concerned about the content? Get in touch with us directly. Alternatively, email editorial-team@simplywallst.com