
 Nasdaq
 華爾街日報
華爾街日報Is Archer Aviation Still Attractive After Volatile 296.7% Three Year Surge?
- For investors wondering whether Archer Aviation is still a smart way to gain exposure to the electric air taxi theme at today's price, or whether most of the potential future upside is already reflected in the stock, this article is designed to walk through that question step by step.
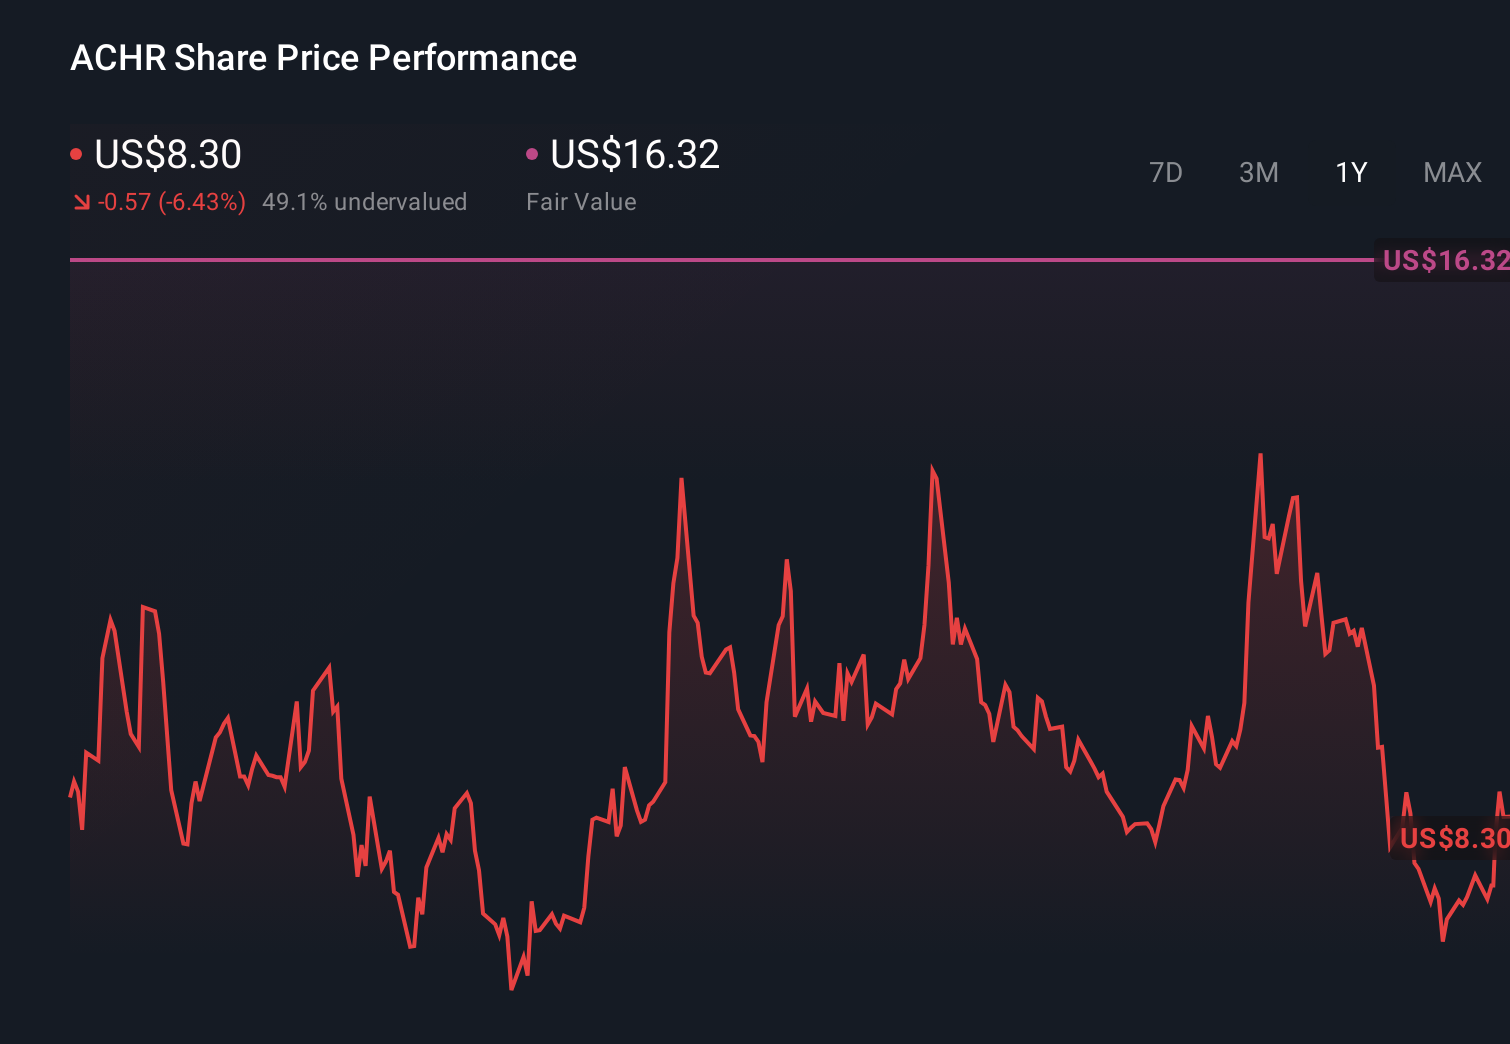
- The stock has been volatile, slipping 0.9% over the last month and 12.5% year to date, but it is still up 13.3% over the last year and an eye catching 296.7% over three years. This indicates that sentiment around the stock can shift quickly.
- Recent attention has centered on Archer's progress toward commercializing its Midnight eVTOL aircraft, including regulatory milestones, key partnership announcements, and expanding test flight programs. These developments contribute to expectations for future revenue. At the same time, broader market swings in high growth and speculative names have amplified moves in Archer's share price as investors reassess risk and timelines.
- Using our framework, Archer Aviation currently scores 2/6 on valuation checks. This suggests that while it appears undervalued on a couple of metrics, the full picture is more nuanced. We will compare different valuation approaches before returning to a more practical way to think about what the stock may be worth.
Archer Aviation scores just 2/6 on our valuation checks. See what other red flags we found in the full valuation breakdown.
Approach 1: Archer Aviation Discounted Cash Flow (DCF) Analysis
A Discounted Cash Flow model estimates what a company is worth by projecting its future cash flows and discounting them back to today using a required rate of return. For Archer Aviation, the DCF uses a 2 stage Free Cash Flow to Equity approach. It starts from last twelve months free cash flow of about $481.4 million in the red, reflecting heavy investment in development.
Analysts expect cash flows to remain negative in the near term, with projected free cash flow of roughly $550.2 million negative in 2026 and $451.2 million negative in 2027, before turning positive. By 2029, free cash flow is forecast to reach about $232 million, and Simply Wall St extrapolates this further to an estimated $1.22 billion by 2035 as the business scales.
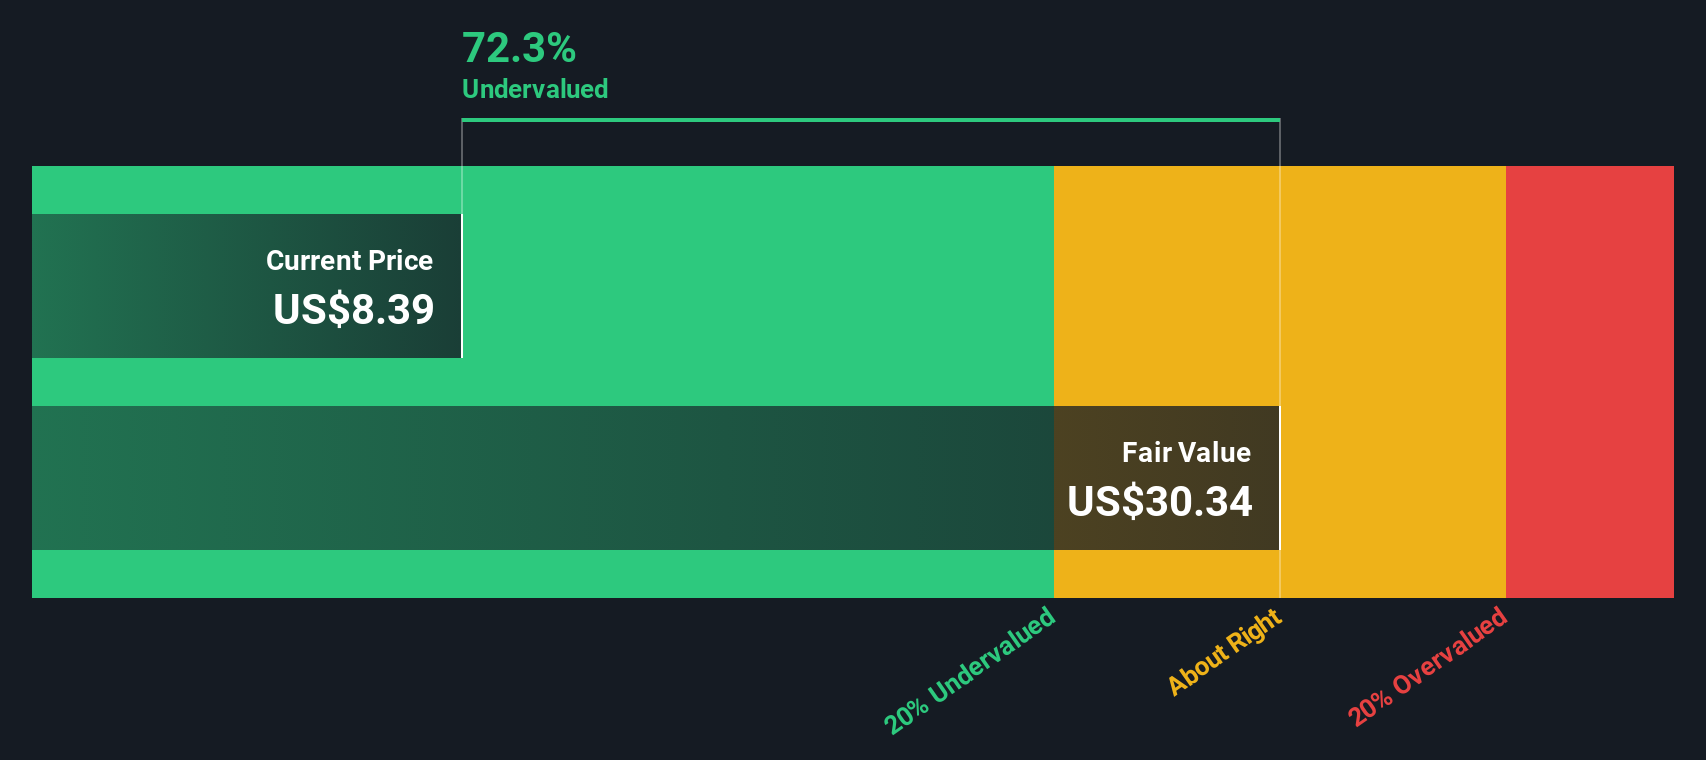
When all these future cash flows are discounted back, the model arrives at an intrinsic value of about $22.30 per share. This implies Archer is roughly 62.5% undervalued relative to its current share price.
Result: UNDERVALUED
Our Discounted Cash Flow (DCF) analysis suggests Archer Aviation is undervalued by 62.5%. Track this in your watchlist or portfolio, or discover 908 more undervalued stocks based on cash flows.
Approach 2: Archer Aviation Price vs Book
For early stage or unprofitable companies like Archer Aviation, the price to book ratio is often more informative than earnings based metrics. It anchors valuation to the net assets investors are funding today rather than profits that are still years away.
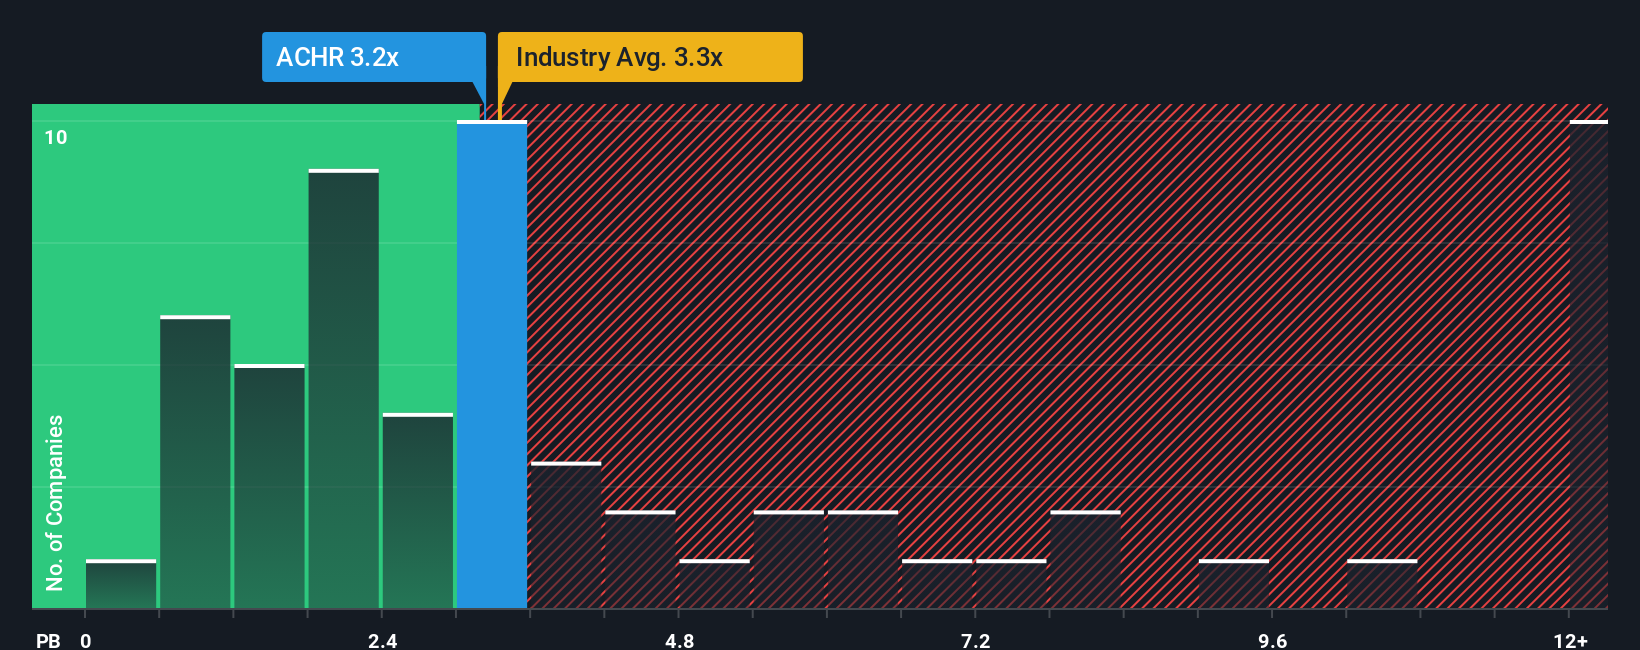
In general, higher growth prospects and lower perceived risk justify paying a higher price to book multiple. Slower growth or greater uncertainty usually call for a discount. Archer currently trades at about 3.71x book value, slightly above the Aerospace and Defense industry average of around 3.56x and notably higher than the peer group average of roughly 2.17x. On those simple comparisons alone, the stock can look expensive.
Simply Wall St’s Fair Ratio is designed to refine this view by estimating what Archer’s price to book multiple should be, given its growth outlook, risk profile, profitability potential, industry, and market cap. Because it integrates these company specific factors, it is more informative than a basic peer or sector comparison. Comparing Archer’s actual multiple with this Fair Ratio suggests investors are paying a premium that is not fully justified by the fundamentals right now.
Result: OVERVALUED
PB ratios tell one story, but what if the real opportunity lies elsewhere? Discover 1446 companies where insiders are betting big on explosive growth.
Upgrade Your Decision Making: Choose your Archer Aviation Narrative
Earlier we mentioned that there is an even better way to understand valuation, so let us introduce you to Narratives, a simple way to connect your view of a company’s story with the numbers behind its future. A Narrative is your own scenario for Archer Aviation, where you describe what you think will happen to its revenue, earnings and margins, and the platform then turns that story into a financial forecast and a fair value estimate. On Simply Wall St’s Community page, used by millions of investors, Narratives are easy to create and compare. They help you quickly see whether your fair value is above or below today’s share price, and therefore whether Archer looks like a buy, hold or sell to you. Because Narratives update automatically when fresh news, earnings or guidance is released, your view stays dynamic instead of static. For example, one Archer Narrative might assume rapid adoption of air taxis and a high fair value, while another might assume slower regulation and lower margins, leading to a much more conservative valuation.
Do you think there's more to the story for Archer Aviation? Head over to our Community to see what others are saying!
This article by Simply Wall St is general in nature. We provide commentary based on historical data and analyst forecasts only using an unbiased methodology and our articles are not intended to be financial advice. It does not constitute a recommendation to buy or sell any stock, and does not take account of your objectives, or your financial situation. We aim to bring you long-term focused analysis driven by fundamental data. Note that our analysis may not factor in the latest price-sensitive company announcements or qualitative material. Simply Wall St has no position in any stocks mentioned.
Have feedback on this article? Concerned about the content? Get in touch with us directly. Alternatively, email editorial-team@simplywallst.com