
 Nasdaq
 華爾街日報
華爾街日報TDG Gold Corp.'s (CVE:TDG) market cap touched CA$233m last week, benefiting both individual investors who own 52% as well as institutions
Key Insights
- The considerable ownership by individual investors in TDG Gold indicates that they collectively have a greater say in management and business strategy
- The top 19 shareholders own 41% of the company
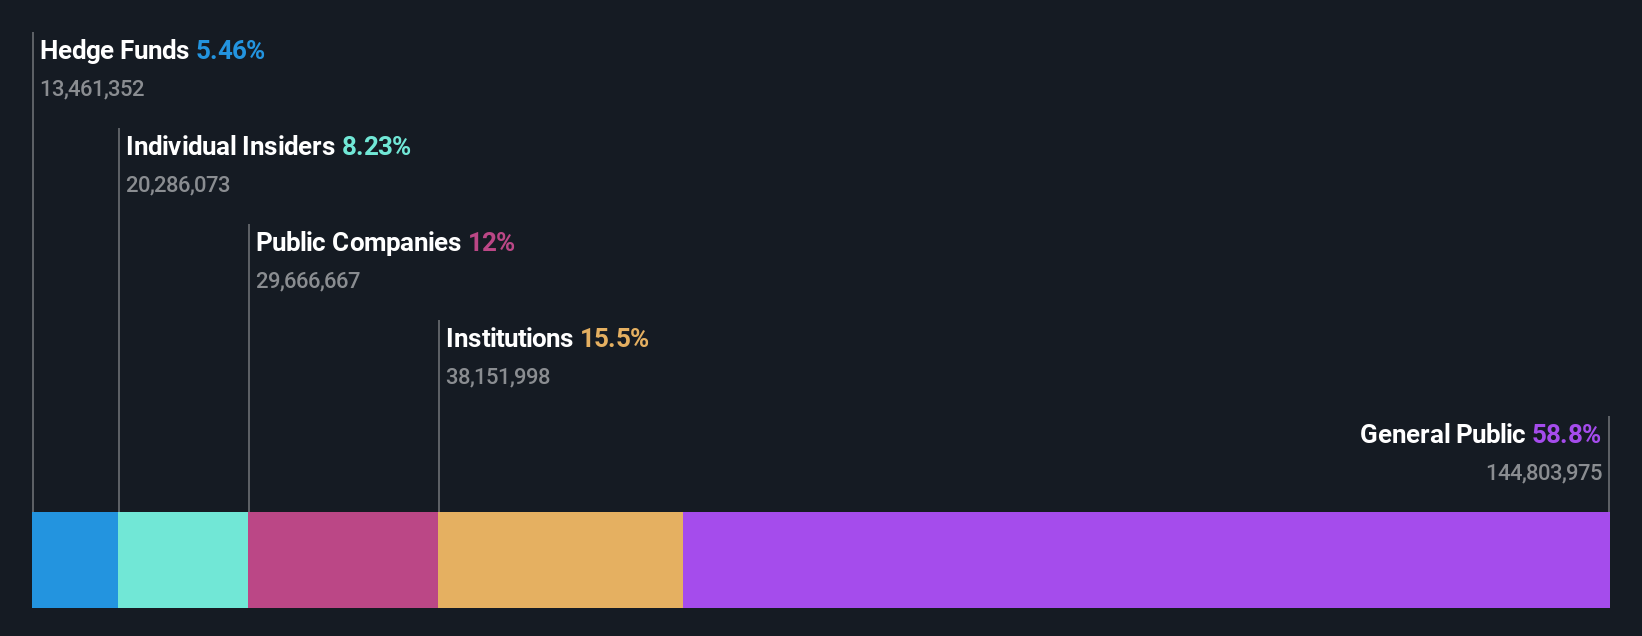
- Institutions own 14% of TDG Gold
Every investor in TDG Gold Corp. (CVE:TDG) should be aware of the most powerful shareholder groups. We can see that individual investors own the lion's share in the company with 52% ownership. Put another way, the group faces the maximum upside potential (or downside risk).
While individual investors were the group that benefitted the most from last week’s CA$36m market cap gain, institutions too had a 14% share in those profits.
Let's take a closer look to see what the different types of shareholders can tell us about TDG Gold.
See our latest analysis for TDG Gold
What Does The Institutional Ownership Tell Us About TDG Gold?
Institutional investors commonly compare their own returns to the returns of a commonly followed index. So they generally do consider buying larger companies that are included in the relevant benchmark index.
TDG Gold already has institutions on the share registry. Indeed, they own a respectable stake in the company. This can indicate that the company has a certain degree of credibility in the investment community. However, it is best to be wary of relying on the supposed validation that comes with institutional investors. They too, get it wrong sometimes. When multiple institutions own a stock, there's always a risk that they are in a 'crowded trade'. When such a trade goes wrong, multiple parties may compete to sell stock fast. This risk is higher in a company without a history of growth. You can see TDG Gold's historic earnings and revenue below, but keep in mind there's always more to the story.

It looks like hedge funds own 4.9% of TDG Gold shares. That worth noting, since hedge funds are often quite active investors, who may try to influence management. Many want to see value creation (and a higher share price) in the short term or medium term. Looking at our data, we can see that the largest shareholder is Skeena Resources Limited with 12% of shares outstanding. With 7.2% and 5.5% of the shares outstanding respectively, Michael Kosowan and CQS (UK) LLP are the second and third largest shareholders.
A deeper look at our ownership data shows that the top 19 shareholders collectively hold less than half of the register, suggesting a large group of small holders where no single shareholder has a majority.
Researching institutional ownership is a good way to gauge and filter a stock's expected performance. The same can be achieved by studying analyst sentiments. Our information suggests that there isn't any analyst coverage of the stock, so it is probably little known.
Insider Ownership Of TDG Gold
The definition of company insiders can be subjective and does vary between jurisdictions. Our data reflects individual insiders, capturing board members at the very least. Company management run the business, but the CEO will answer to the board, even if he or she is a member of it.
I generally consider insider ownership to be a good thing. However, on some occasions it makes it more difficult for other shareholders to hold the board accountable for decisions.
We can report that insiders do own shares in TDG Gold Corp.. In their own names, insiders own CA$17m worth of stock in the CA$233m company. It is good to see some investment by insiders, but we usually like to see higher insider holdings. It might be worth checking if those insiders have been buying.
General Public Ownership
The general public, mostly comprising of individual investors, collectively holds 52% of TDG Gold shares. This size of ownership gives investors from the general public some collective power. They can and probably do influence decisions on executive compensation, dividend policies and proposed business acquisitions.
Public Company Ownership
Public companies currently own 11% of TDG Gold stock. It's hard to say for sure but this suggests they have entwined business interests. This might be a strategic stake, so it's worth watching this space for changes in ownership.
Next Steps:
While it is well worth considering the different groups that own a company, there are other factors that are even more important. For example, we've discovered 4 warning signs for TDG Gold (3 make us uncomfortable!) that you should be aware of before investing here.
Of course, you might find a fantastic investment by looking elsewhere. So take a peek at this free list of interesting companies.
NB: Figures in this article are calculated using data from the last twelve months, which refer to the 12-month period ending on the last date of the month the financial statement is dated. This may not be consistent with full year annual report figures.
Have feedback on this article? Concerned about the content? Get in touch with us directly. Alternatively, email editorial-team (at) simplywallst.com.
This article by Simply Wall St is general in nature. We provide commentary based on historical data and analyst forecasts only using an unbiased methodology and our articles are not intended to be financial advice. It does not constitute a recommendation to buy or sell any stock, and does not take account of your objectives, or your financial situation. We aim to bring you long-term focused analysis driven by fundamental data. Note that our analysis may not factor in the latest price-sensitive company announcements or qualitative material. Simply Wall St has no position in any stocks mentioned.