
 Nasdaq
 華爾街日報
華爾街日報Is Instacart’s Recent Share Price Jump Justified by Its Cash Flow Prospects?
- Wondering if Maplebear at around $43 is quietly turning into a value opportunity, or if the easy money has already been made? You are not alone, and that is exactly what this breakdown is here to unpack.
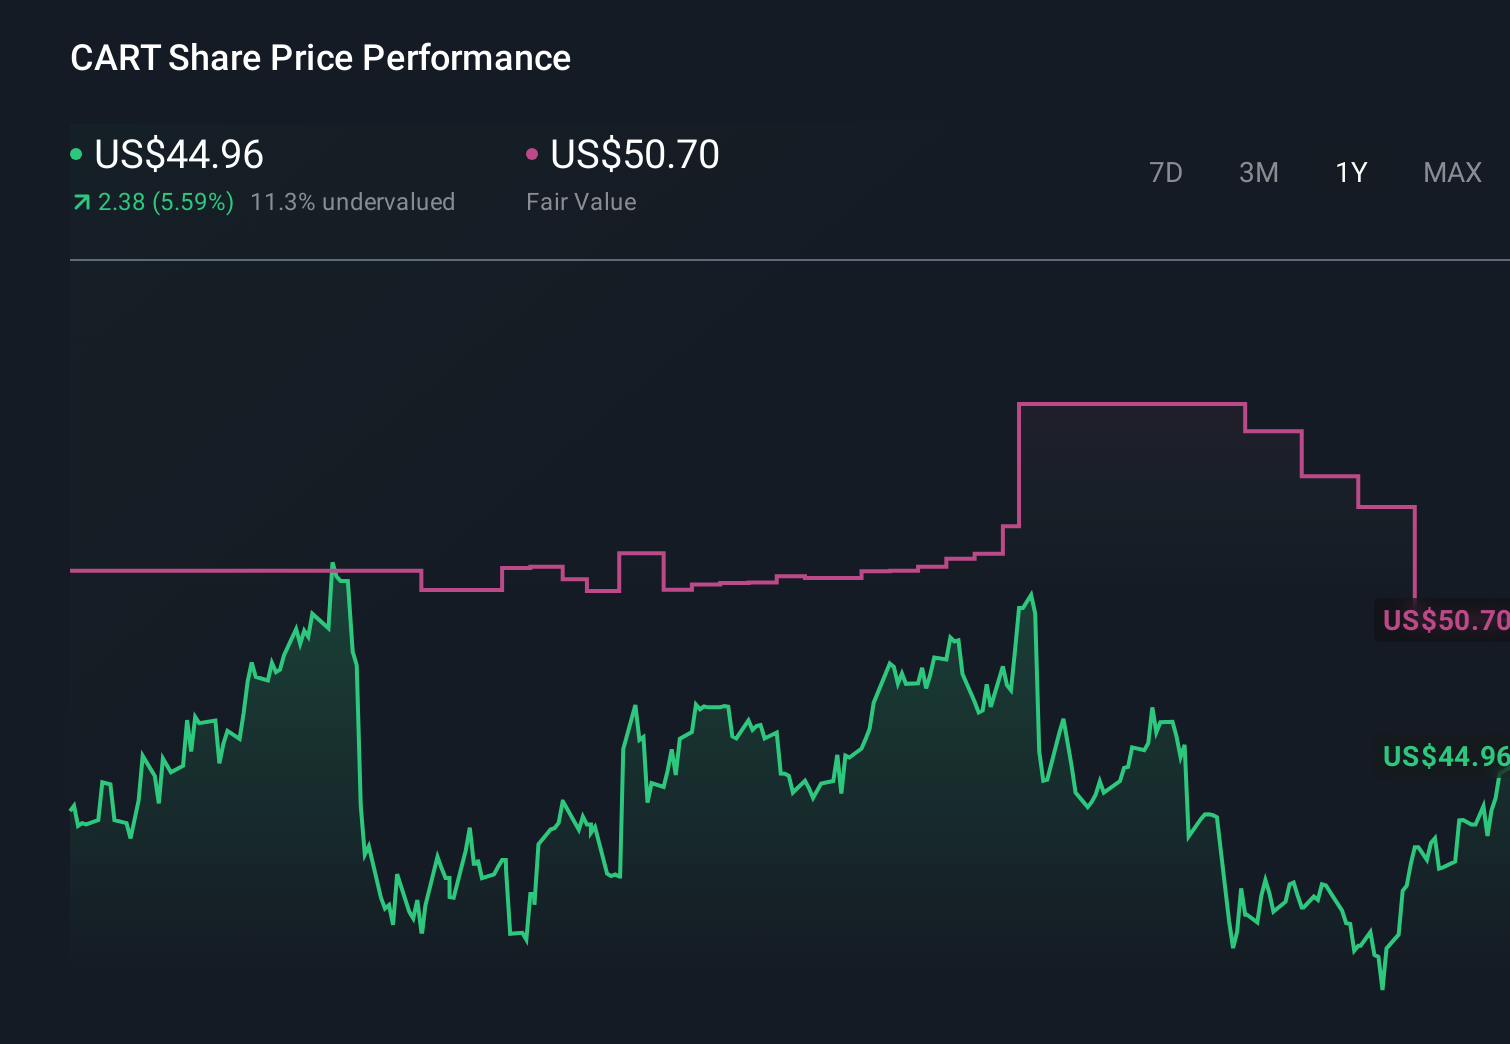
- The stock has crept up 2.0% over the last week and 16.5% over the past month, but is only up 4.4% over the last year. This pattern hints at shifting sentiment more than a full re-rating so far.
- Recent headlines around Maplebear have focused on the company sharpening its operating model and leaning further into partnerships that deepen its role in everyday grocery and convenience shopping. This helps explain why investors are revisiting the story. At the same time, growing attention on the broader delivery and logistics space has pulled capital back toward platforms that already have scale, putting Maplebear back on more watchlists.
- On our framework, Maplebear scores a 3 out of 6 on valuation checks, suggesting it looks undervalued on some metrics but not convincingly cheap across the board. Next, we will walk through each approach to see where the market might be roughly right, where it may be off, and finally, explore a more powerful way to think about valuation beyond any single model.
Find out why Maplebear's 4.4% return over the last year is lagging behind its peers.
Approach 1: Maplebear Discounted Cash Flow (DCF) Analysis
A Discounted Cash Flow model estimates what a business is worth by projecting the cash it can generate in the future and discounting those cash flows back to today in $ terms. For Maplebear, the starting point is last twelve month free cash flow of about $878.8 million, which analysts expect to grow steadily as the platform scales and efficiency improves.
Under the 2 Stage Free Cash Flow to Equity approach, analyst forecasts cover the next few years, with Simply Wall St extrapolating beyond that. By 2029, Maplebear’s free cash flow is projected to reach roughly $1.1 billion, and the model then tapers growth further into the next decade. Each of these future cash flows is discounted back to present value to account for risk and the time value of money.
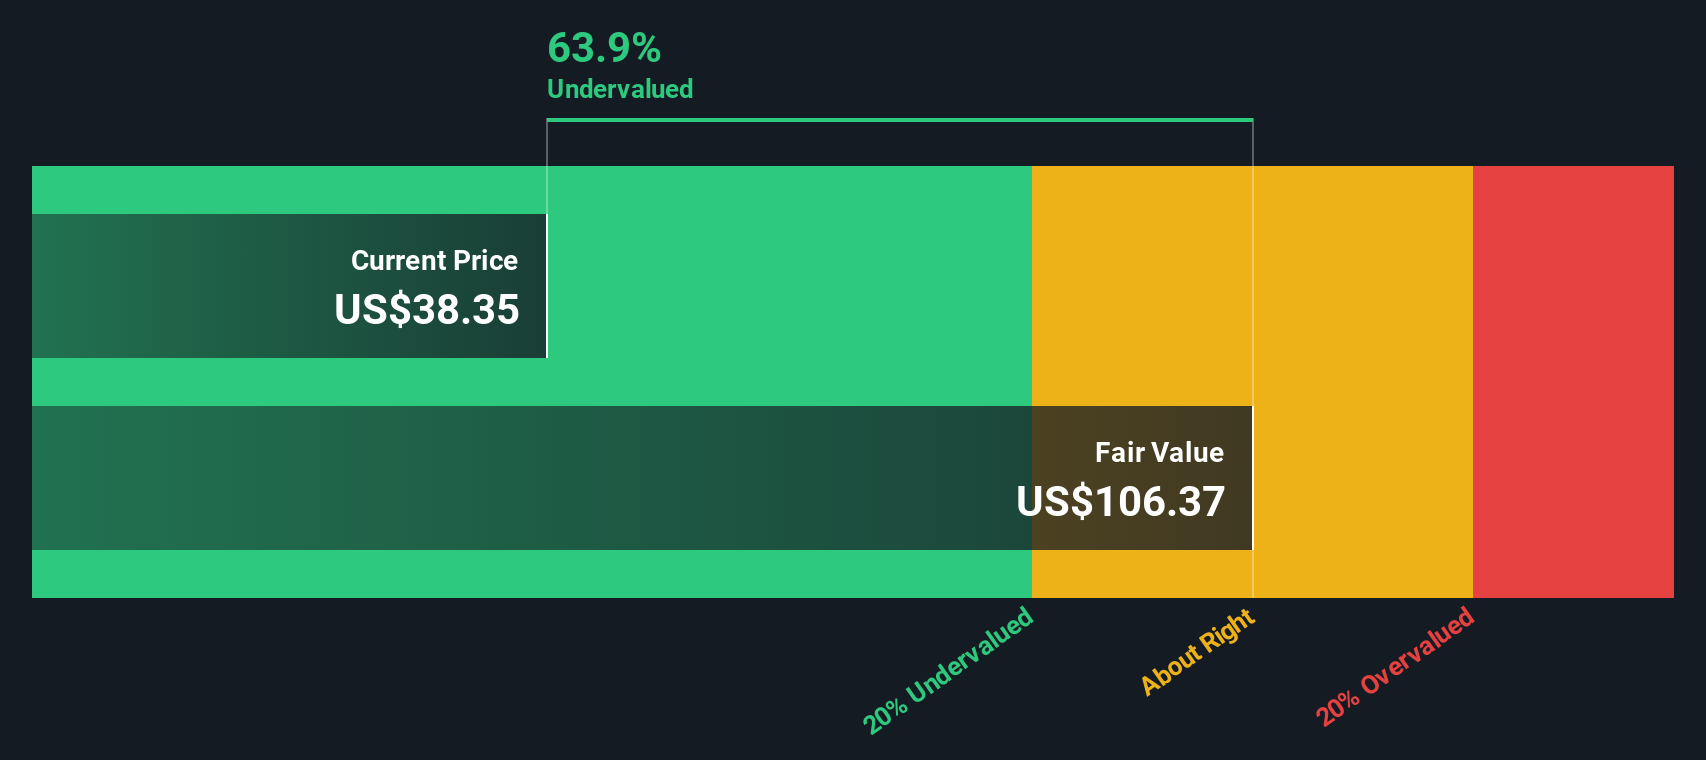
Pulling these projections together, the DCF model arrives at an estimated intrinsic value of about $94.63 per share. With the stock trading around $43, this implies it is roughly 54.0% undervalued on a cash flow basis, suggesting a wide margin of safety if the forecasts prove reasonable.
Result: UNDERVALUED
Our Discounted Cash Flow (DCF) analysis suggests Maplebear is undervalued by 54.0%. Track this in your watchlist or portfolio, or discover 906 more undervalued stocks based on cash flows.
Approach 2: Maplebear Price vs Earnings
For a company like Maplebear that is now generating consistent profits, the price to earnings, or PE, ratio is a useful way to gauge how much investors are paying for each dollar of earnings. In general, higher growth and lower perceived risk justify a higher PE, while slower growth or more uncertainty usually cap what the market is willing to pay.
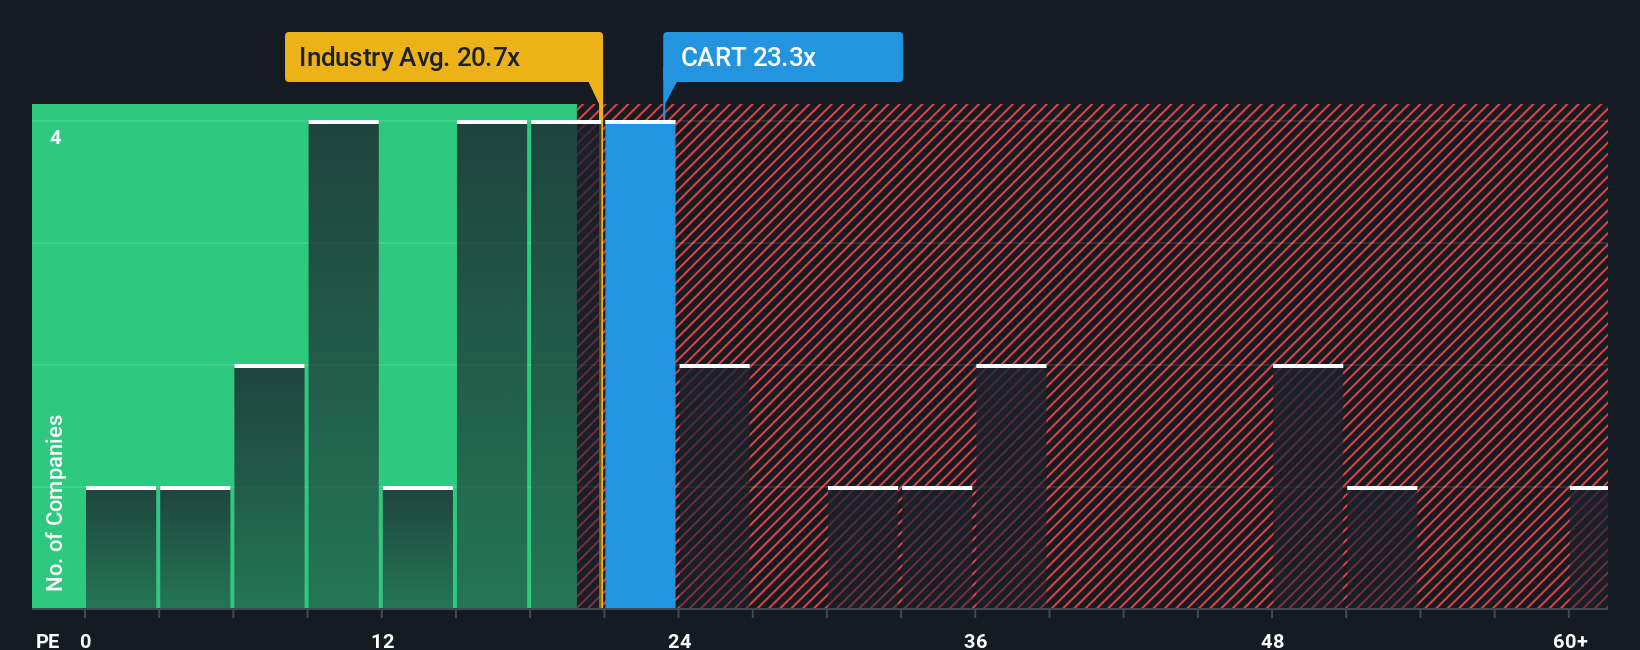
Maplebear currently trades on a PE of about 22.6x, a touch above the Consumer Retailing industry average of roughly 21.7x but below the peer group average near 27.5x. Simply Wall St also calculates a Fair Ratio of 18.2x, which is the PE you might expect given Maplebear’s specific mix of earnings growth, margins, industry, size, and risk profile.
This Fair Ratio is more informative than a simple comparison with peers or the sector, because it adjusts for Maplebear’s own fundamentals rather than assuming that all retailers should trade on the same multiple. With the actual PE of 22.6x sitting meaningfully above the 18.2x Fair Ratio, the multiple based view suggests the shares are leaning toward the expensive side.
Result: OVERVALUED
PE ratios tell one story, but what if the real opportunity lies elsewhere? Discover 1448 companies where insiders are betting big on explosive growth.
Upgrade Your Decision Making: Choose your Maplebear Narrative
Earlier we mentioned that there is an even better way to understand valuation, so let us introduce you to Narratives, a simple way to connect your view of Maplebear’s story with the numbers behind its future revenue, earnings and margins, and ultimately the fair value you think is reasonable.
A Narrative on Simply Wall St is your own investment story for a company, where you spell out what you think will drive the business, translate that into a financial forecast, and then see the fair value that falls out of those assumptions.
Because a Narrative links story to forecast to valuation, it becomes an easy decision making tool, helping you compare your Fair Value to the current share price so you can decide whether Maplebear looks like a buy, a hold, or a sell.
Narratives live in the Community section of Simply Wall St’s platform, are used by millions of investors, and update dynamically when new information, such as earnings or news, comes in so your fair value estimate stays relevant without you having to rebuild it from scratch.
For example, one Maplebear Narrative might assume earnings rise quickly and justify a fair value near the top of analyst targets around $67. In contrast, a more cautious Narrative could lean on slower growth and margin pressure to land closer to the most bearish fair value near $42. Seeing where your own view sits between these helps you act with more conviction.
Do you think there's more to the story for Maplebear? Head over to our Community to see what others are saying!
This article by Simply Wall St is general in nature. We provide commentary based on historical data and analyst forecasts only using an unbiased methodology and our articles are not intended to be financial advice. It does not constitute a recommendation to buy or sell any stock, and does not take account of your objectives, or your financial situation. We aim to bring you long-term focused analysis driven by fundamental data. Note that our analysis may not factor in the latest price-sensitive company announcements or qualitative material. Simply Wall St has no position in any stocks mentioned.
Have feedback on this article? Concerned about the content? Get in touch with us directly. Alternatively, email editorial-team@simplywallst.com