
 Nasdaq
 華爾街日報
華爾街日報Does PROS Holdings Offer Value After Expanding Its AI Pricing Capabilities in 2025?
- Wondering if PROS Holdings at around $23 is a quietly mispriced opportunity or a value trap in disguise? You are not alone. This stock often flies under the radar despite operating in a high-potential niche of AI powered pricing and revenue optimization software.
- Over the last month the share price has inched up about 0.5%, contributing to an 8.2% gain year to date. However, that is still set against a rough 5 year journey that has left the stock down more than 50% from its earlier highs.
- Recent headlines have focused on PROS expanding its AI driven product capabilities and deepening relationships with airlines and enterprise customers, reinforcing the narrative that its software is becoming more mission critical. Investors have also been watching ongoing adoption trends in dynamic pricing across travel and industrial markets, which helps explain why sentiment has started to stabilize despite a mixed longer term return profile.
- On our numbers, PROS scores a 4/6 valuation check, suggesting it screens as undervalued on most but not all metrics. Next we will unpack what different valuation approaches say about that score and point to a more holistic way to look at its value by the end of this piece.
Find out why PROS Holdings's -4.6% return over the last year is lagging behind its peers.
Approach 1: PROS Holdings Discounted Cash Flow (DCF) Analysis
A Discounted Cash Flow model estimates what a company is worth by projecting the cash it can generate in the future and discounting those dollars back to today at an appropriate rate. For PROS Holdings, the model starts with last twelve months free cash flow of about $38.2 million and then layers on analyst expectations and longer term projections.
Analysts see free cash flow rising to roughly $57.1 million by 2026 and $73 million by 2027, with Simply Wall St extrapolating further growth toward around $139.9 million by 2035. These projected cash flows, all in dollars, are then discounted back to today using a 2 stage Free Cash Flow to Equity framework, capturing both a higher growth period and a more mature phase.
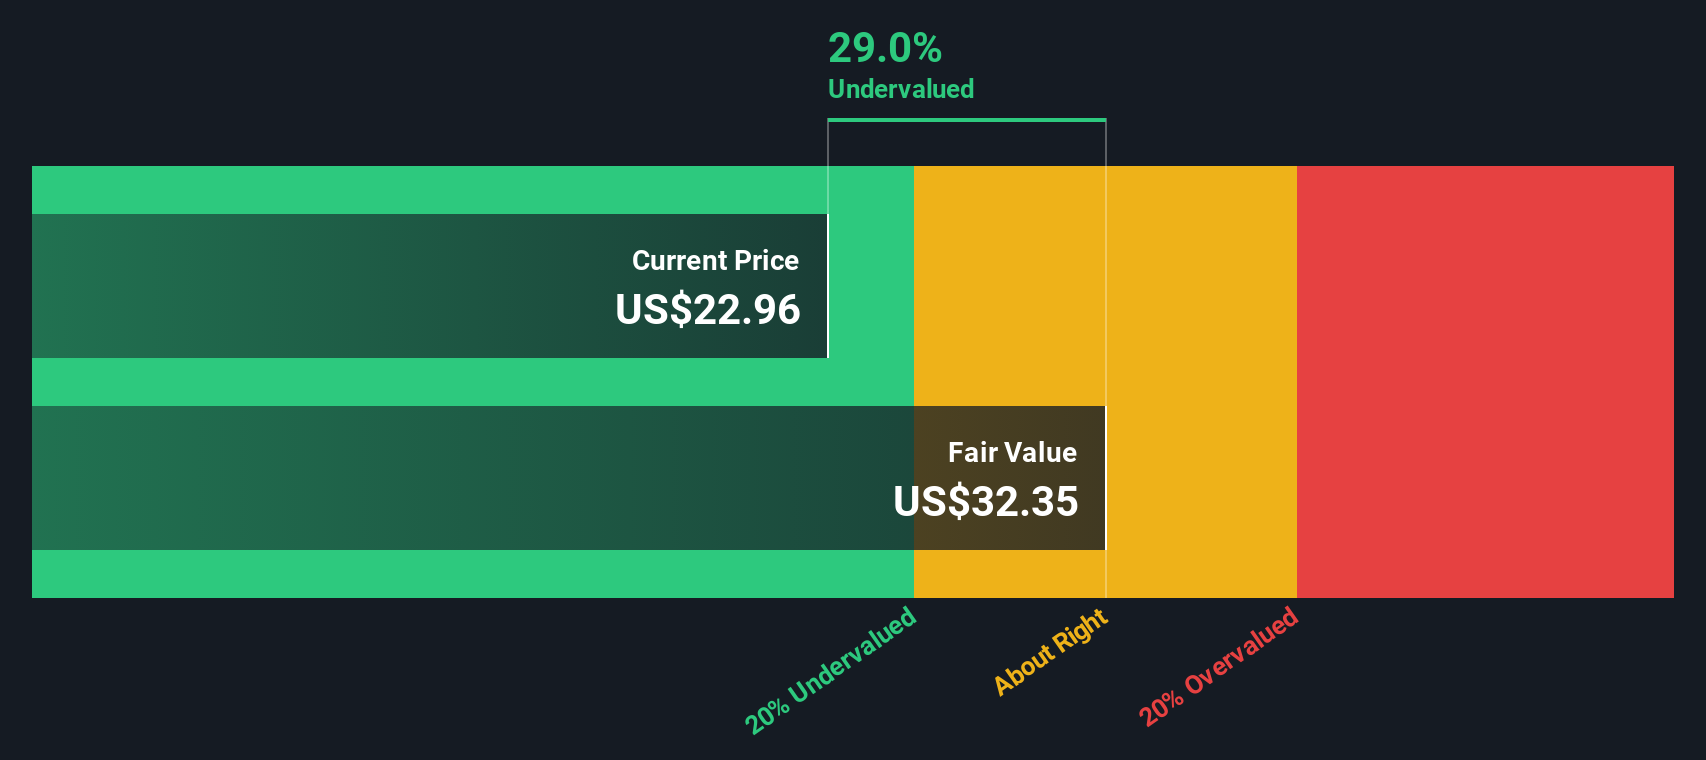
On this basis, the estimated intrinsic value comes out at about $33.06 per share, implying the stock trades at a 29.7% discount to this estimate of fair value at current prices near $23. In other words, the DCF view suggests PROS may be undervalued if these cash flow assumptions play out.
Result: UNDERVALUED
Our Discounted Cash Flow (DCF) analysis suggests PROS Holdings is undervalued by 29.7%. Track this in your watchlist or portfolio, or discover 905 more undervalued stocks based on cash flows.
Approach 2: PROS Holdings Price vs Sales
For a business like PROS that is still prioritizing growth and reinvestment, the price to sales ratio is often a more useful lens than earnings based metrics. It compares investor expectations directly to the company’s current revenue base regardless of short term profitability noise. In general, higher growth and lower risk justify a richer multiple, while slower or more volatile businesses usually deserve a discount.
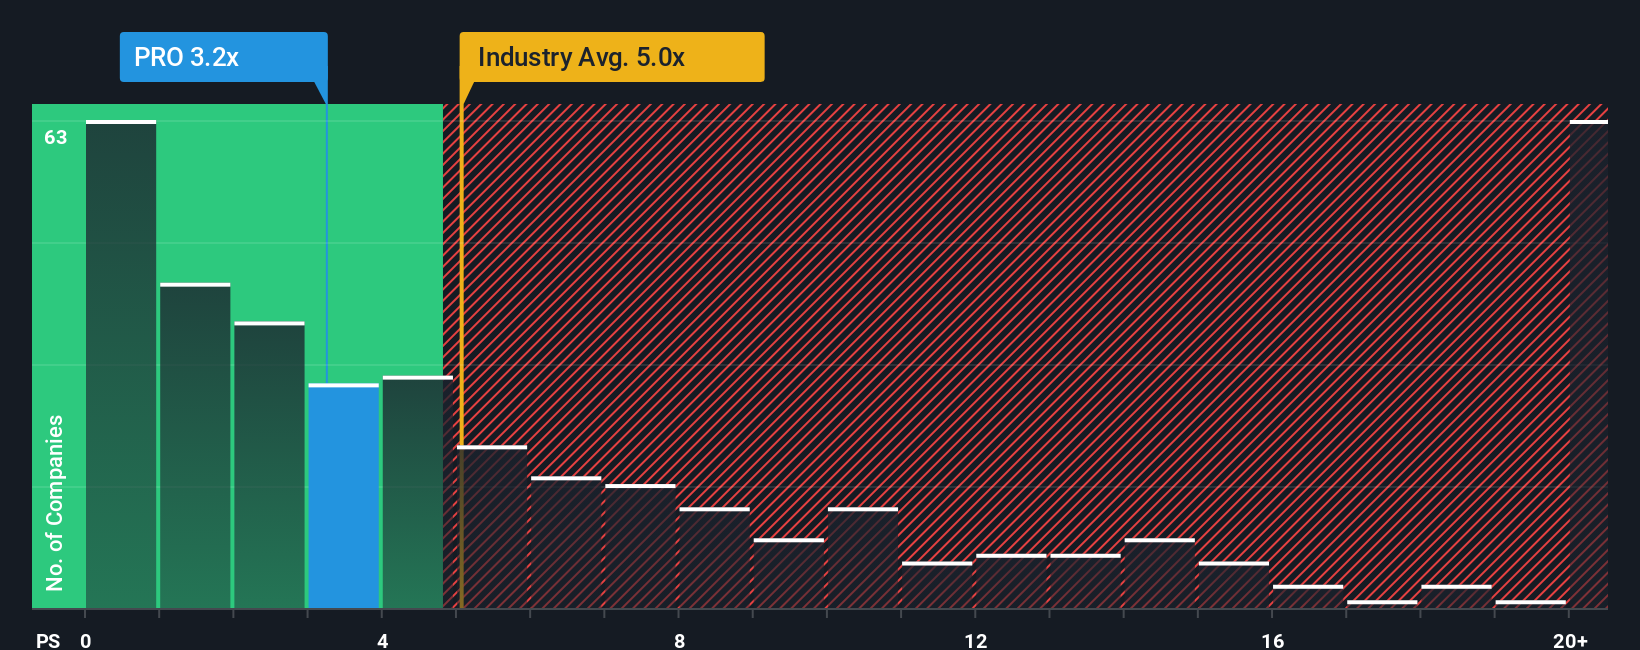
PROS currently trades on a price to sales multiple of about 3.19x, which sits below the broader Software industry average of roughly 4.95x but modestly above the peer group average near 2.49x. Simply Wall St’s Fair Ratio for PROS, at around 3.28x, is a proprietary estimate of what investors might reasonably pay for each dollar of sales given its growth outlook, margins, industry positioning, size and risk profile.
Because the Fair Ratio incorporates these company specific fundamentals, it offers a more tailored benchmark than a simple comparison with industry or peer averages, which can be skewed by very mature or very speculative names. With PROS trading only slightly below its Fair Ratio, the valuation on a sales basis looks broadly in line with what its fundamentals warrant.
Result: ABOUT RIGHT
PS ratios tell one story, but what if the real opportunity lies elsewhere? Discover 1448 companies where insiders are betting big on explosive growth.
Upgrade Your Decision Making: Choose your PROS Holdings Narrative
Earlier we mentioned that there is an even better way to understand valuation, so let us introduce you to Narratives, a simple idea where you spell out the story you believe about a company and connect it directly to your assumptions for future revenue, earnings, margins and ultimately fair value.
A Narrative on Simply Wall St links three things together in one place: the company’s story, a financial forecast that reflects that story, and a resulting fair value that you can compare with today’s share price to decide whether you think it is a buy, hold or sell.
These Narratives live on the Community page used by millions of investors, are easy to set up or browse, and automatically update as new information like earnings, deal announcements or industry news flows in, so your view is never frozen in time.
For PROS Holdings for example, one investor might create a bullish Narrative that leans on the 36.0 dollars upside case, assuming strong AI adoption, resilient margins and a smooth buyout process, while another might publish a more cautious Narrative anchored closer to 18.0 dollars, focusing on deal risk, competitive pressure and slower than expected growth, and both can see in real time how those stories stack up against the current price.
Do you think there's more to the story for PROS Holdings? Head over to our Community to see what others are saying!

This article by Simply Wall St is general in nature. We provide commentary based on historical data and analyst forecasts only using an unbiased methodology and our articles are not intended to be financial advice. It does not constitute a recommendation to buy or sell any stock, and does not take account of your objectives, or your financial situation. We aim to bring you long-term focused analysis driven by fundamental data. Note that our analysis may not factor in the latest price-sensitive company announcements or qualitative material. Simply Wall St has no position in any stocks mentioned.
Have feedback on this article? Concerned about the content? Get in touch with us directly. Alternatively, email editorial-team@simplywallst.com