
 Nasdaq
 華爾街日報
華爾街日報Does Enbridge’s 2025 Valuation Still Make Sense After Recent Price Pullback?
- Wondering if Enbridge is still a smart buy at today’s price, or if the easy gains are already behind it? This breakdown will help you decide whether the current tag matches the company’s true value.
- Despite a recent pullback of around 2.3% over the last week and 3.0% over the last month, Enbridge is still up roughly 5.3% year to date, 15.1% over the past year, 47.6% over 3 years, and 113.4% over 5 years.
- Recently, investors have been watching Enbridge’s large pipeline and gas utility expansion plans, alongside ongoing regulatory decisions in both Canada and the US, which shape expectations for the stability of its future cash flows. At the same time, headlines around energy transition policy, interest rates, and income-focused investing have all helped frame how the market is thinking about a high-yield infrastructure company like this.
- Right now, Enbridge scores just 2/6 on our valuation checks, which suggests some parts of the market may be pricing it a bit richly while others hint at value. In the sections ahead we walk through those methods one by one, then finish with a more complete way of thinking about what Enbridge is worth.
Enbridge scores just 2/6 on our valuation checks. See what other red flags we found in the full valuation breakdown.
Approach 1: Enbridge Discounted Cash Flow (DCF) Analysis
A Discounted Cash Flow, or DCF, model estimates what a company is worth by projecting the cash it can generate in the future and then discounting those amounts back into today’s dollars.
For Enbridge, the latest twelve month Free Cash Flow is about CA$4.9 billion. Analysts provide detailed forecasts for the next few years, and beyond that Simply Wall St extrapolates growth, resulting in projected Free Cash Flow of roughly CA$28.0 billion by 2035. These cash flows are modeled using a 2 Stage Free Cash Flow to Equity approach, where growth is higher in the early years and then tapers as the business matures.
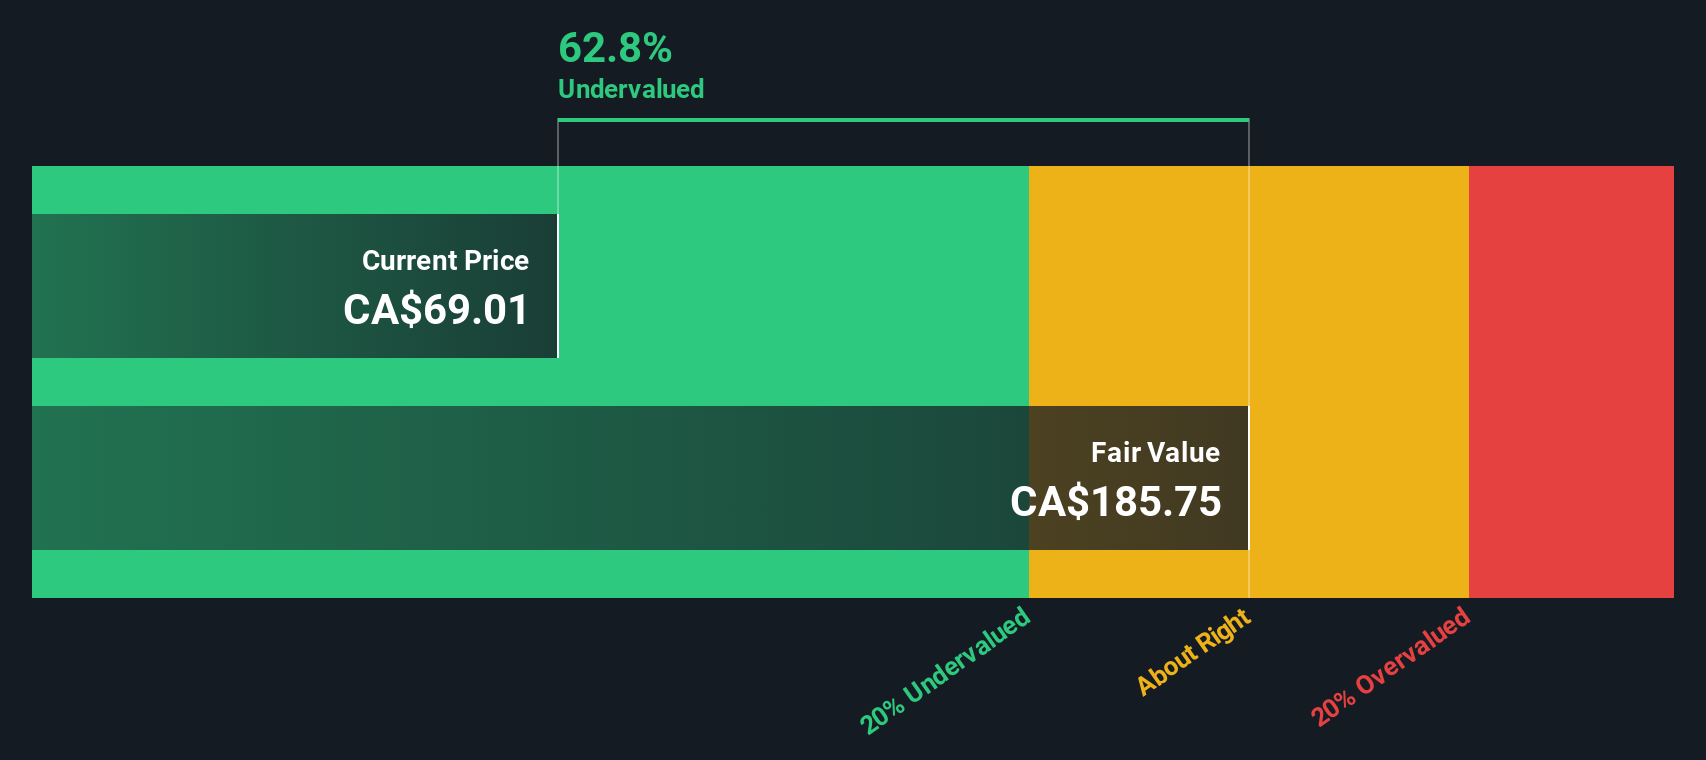
Adding up all these discounted cash flows gives an estimated intrinsic value of about CA$245.14 per share. Compared with the current market price, this implies a 73.4% discount, suggesting investors are paying far less than what the future cash flows might justify if the assumptions prove accurate.
Result: UNDERVALUED
Our Discounted Cash Flow (DCF) analysis suggests Enbridge is undervalued by 73.4%. Track this in your watchlist or portfolio, or discover 905 more undervalued stocks based on cash flows.
Approach 2: Enbridge Price vs Earnings
For a mature, profitable company like Enbridge, the Price to Earnings, or PE, ratio is a practical way to gauge whether the market price makes sense relative to the profits it generates. Investors typically accept a higher PE when they expect stronger growth or see the earnings stream as very reliable. In contrast, slower growth or higher risk usually deserves a lower, more conservative multiple.
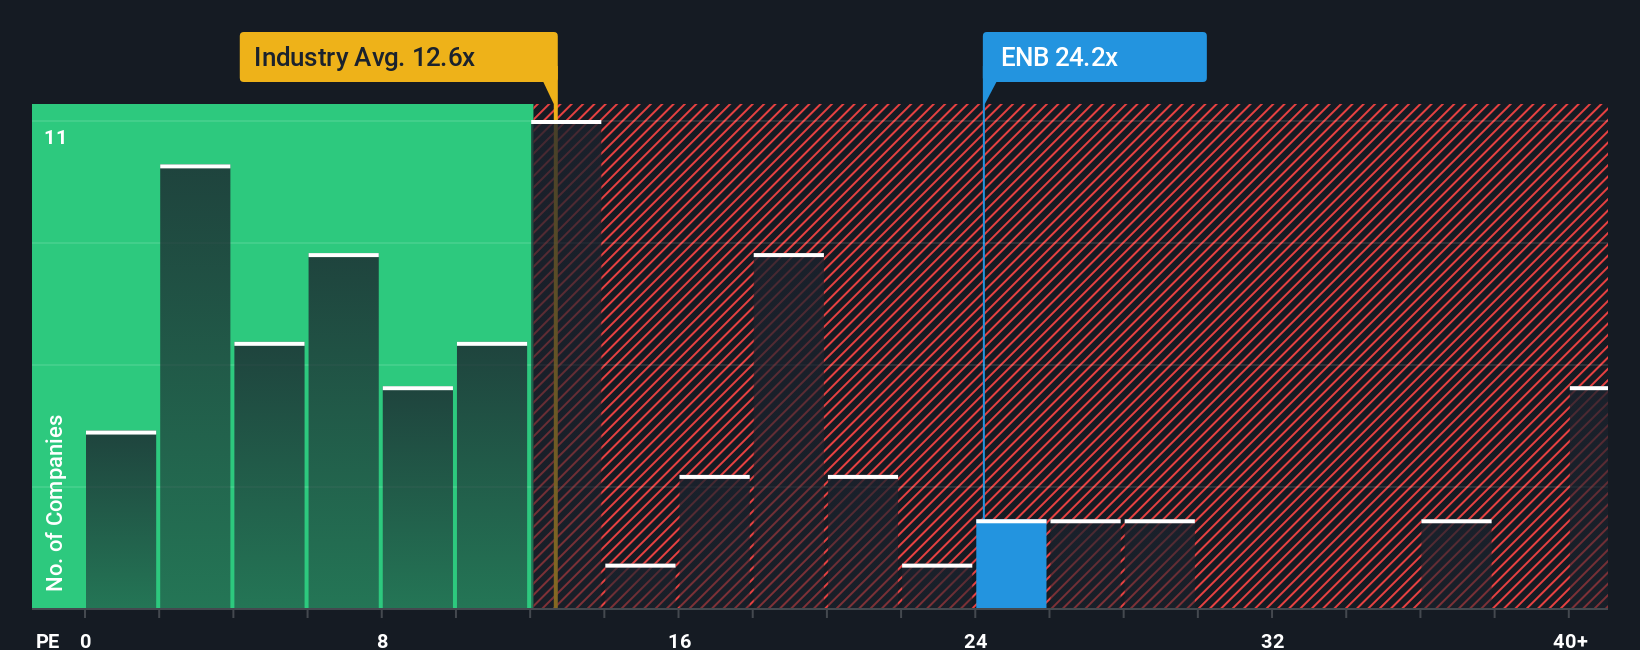
Enbridge currently trades on a PE of about 25.44x. That is meaningfully above the broader Oil and Gas industry average of roughly 14.87x and also higher than the peer group average of about 19.92x, suggesting the market is already paying a premium for its earnings. To refine this view, Simply Wall St uses a proprietary Fair Ratio of 20.64x, which estimates what a justified PE should be after considering Enbridge’s earnings growth outlook, profit margins, risk profile, industry, and market capitalization.
This Fair Ratio is more informative than a simple comparison to peers or the sector, because it adjusts for company specific strengths and risks rather than assuming all energy names deserve the same multiple. Since Enbridge’s current 25.44x PE stands well above the 20.64x Fair Ratio, the shares appear somewhat expensive on this measure.
Result: OVERVALUED
PE ratios tell one story, but what if the real opportunity lies elsewhere? Discover 1448 companies where insiders are betting big on explosive growth.
Upgrade Your Decision Making: Choose your Enbridge Narrative
Earlier we mentioned that there is an even better way to understand valuation, so let us introduce you to Narratives, a simple framework that lets you describe the story you believe about a company and then connect that story to specific forecasts for revenue, earnings, margins, and ultimately a fair value estimate. On Simply Wall St’s Community page, millions of investors build Narratives by laying out why they think a business like Enbridge will succeed or struggle, translating that view into numbers, and then comparing the Narrative Fair Value with today’s share price to decide whether it looks like a buy, hold, or sell. Because Narratives are updated dynamically as fresh news, earnings, and guidance come in, your view of Enbridge’s value evolves instead of going stale. For example, some Enbridge Narratives currently see fair value clustering toward the high end of analyst targets near about CA$77, based on resilient US driven growth and dividend stability, while others sit closer to the low end near roughly CA$60, reflecting concerns about regulation, decarbonization, and leverage, and the platform helps you see exactly which assumptions drive those differences.
Do you think there's more to the story for Enbridge? Head over to our Community to see what others are saying!

This article by Simply Wall St is general in nature. We provide commentary based on historical data and analyst forecasts only using an unbiased methodology and our articles are not intended to be financial advice. It does not constitute a recommendation to buy or sell any stock, and does not take account of your objectives, or your financial situation. We aim to bring you long-term focused analysis driven by fundamental data. Note that our analysis may not factor in the latest price-sensitive company announcements or qualitative material. Simply Wall St has no position in any stocks mentioned.
Have feedback on this article? Concerned about the content? Get in touch with us directly. Alternatively, email editorial-team@simplywallst.com