
 Nasdaq
 華爾街日報
華爾街日報Is Oracle’s 2025 AI Cloud Surge Already Reflected in the Share Price?
- If you are wondering whether Oracle is still a smart buy after its huge run, or if you would be overpaying at today’s price, this article walks through what the numbers actually say about its value.
- Oracle has climbed 34.6% year to date and 183.5% over three years, but that strength comes with some recent volatility, including a 7.6% gain over the last week after a 7.2% slide across the past month.
- Those swings sit against a backdrop of ongoing enthusiasm around Oracle’s role in cloud infrastructure and databases, as investors weigh how its AI and cloud partnerships might shift its long term growth profile. At the same time, the broader tech rally and shifting interest rate expectations have pushed many software names higher, raising questions about how much of Oracle’s future is already priced in.
- On our framework, Oracle scores just 2/6 on valuation checks. This suggests the market may be paying up for its strengths, but not wildly mispricing it. We will unpack what that score really means using different valuation approaches, then finish with a more intuitive way to think about Oracle’s worth than any single model alone.
Oracle scores just 2/6 on our valuation checks. See what other red flags we found in the full valuation breakdown.
Approach 1: Oracle Discounted Cash Flow (DCF) Analysis
A Discounted Cash Flow, or DCF, model estimates what a company is worth by projecting the cash it can generate in the future and discounting those cash flows back to today in $ terms.
Oracle currently generates roughly $5.8 billion in free cash flow. Based on analyst forecasts and Simply Wall St extrapolations, those cash flows are expected to dip into negative territory in the later 2020s before ramping up, with projected free cash flow of about $22.3 billion by 2030 and over $66 billion by 2035. These longer term numbers are model based, not direct analyst estimates, and assume Oracle can compound its cash generation meaningfully as its cloud and AI businesses scale.
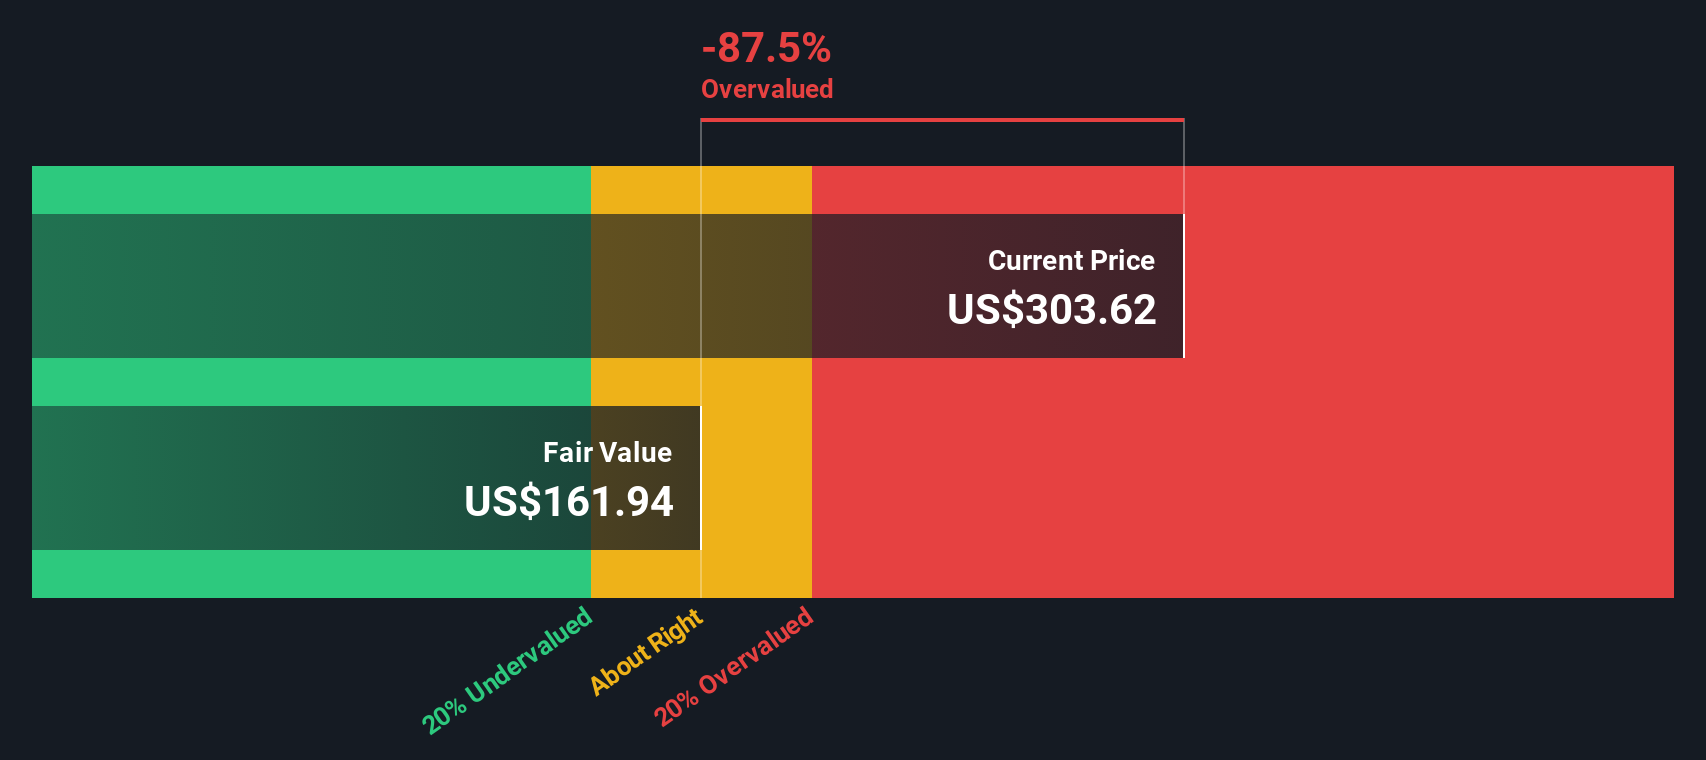
When all those projected cash flows are discounted back using a required return for equity investors, the DCF model arrives at an intrinsic value of about $219 per share. That is roughly 2.1% above the current share price, which implies the stock is slightly overvalued, but only marginally so in practical terms.
Result: ABOUT RIGHT
Oracle is fairly valued according to our Discounted Cash Flow (DCF), but this can change at a moment's notice. Track the value in your watchlist or portfolio and be alerted on when to act.
Approach 2: Oracle Price vs Earnings
For profitable, mature businesses like Oracle, the price to earnings, or PE, ratio is a useful yardstick because it links what investors pay today to the profits the company is already generating. In general, faster growth and lower risk justify a higher PE, while slower or more uncertain growth should trade on a lower multiple.
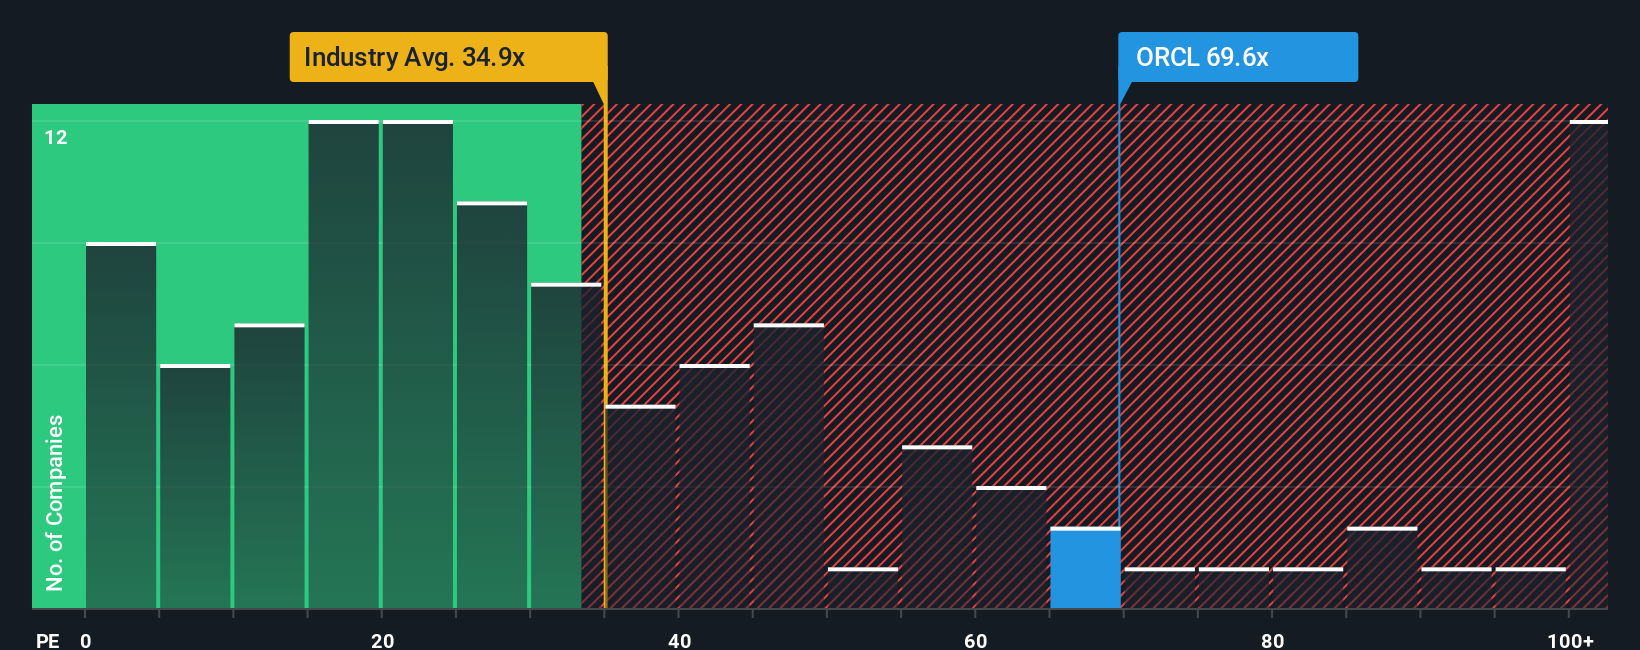
Oracle currently trades on about 51.2x earnings. That is well above the broader Software industry average of roughly 32.7x, but actually below the average of its closer large cap peers, which sits near 72.2x. To move beyond simple comparisons, Simply Wall St uses a proprietary Fair Ratio, an estimate of what a reasonable PE should be once you factor in Oracle’s earnings growth outlook, profitability, risk profile, size, and industry. This framework is more informative than a straight industry or peer average because it accounts for how Oracle specifically differs from those groups.
On this basis, Oracle’s Fair Ratio is about 57.0x, modestly above the current 51.2x. That suggests the market may be pricing the stock slightly below what its fundamentals would justify.
Result: UNDERVALUED
PE ratios tell one story, but what if the real opportunity lies elsewhere? Discover 1448 companies where insiders are betting big on explosive growth.
Upgrade Your Decision Making: Choose your Oracle Narrative
Earlier we mentioned that there is an even better way to understand valuation. Let us introduce you to Narratives, a simple framework on Simply Wall St’s Community page that lets you tell the story behind your numbers by linking your view of a company’s future revenues, earnings and margins to a financial forecast and a fair value. You can then compare that fair value to today’s share price to decide whether you think it is a buy, hold or sell. The whole Narrative updates dynamically as new news, earnings or guidance arrives. In Oracle’s case, one investor might build a hypergrowth AI infrastructure Narrative with a fair value near $390, while another might build a more measured, cloud first transformation Narrative with a fair value closer to $212. Narratives allows both perspectives to coexist, be compared, and be refined as reality unfolds.
For Oracle however we'll make it really easy for you with previews of two leading Oracle Narratives:
Fair value: $389.81 per share
Implied upside: 42.6% undervalued vs the last close of $223.52
Implied revenue growth: 28.0%
- Frames Oracle as a hypergrowth AI infrastructure leader, validated by its OpenAI partnership and massive GPU superclusters built to support the most demanding AI workloads.
- Highlights an explosive surge in Remaining Performance Obligations to $455 billion, driven by insatiable inference demand and multi cloud deals that push Oracle into a new growth regime.
- Sees a powerful whole stack advantage, where integrated infrastructure, AI database, and application layers drive much higher spend per customer, but warns that execution and supply constraints remain key risks.
Fair value: $212.00 per share
Implied downside: 5.4% overvalued vs the last close of $223.52
Implied revenue growth: 14.39%
- Presents Oracle as a solid, cloud first and AI enabled enterprise IT provider with durable recurring revenues, but not a runaway hypergrowth story.
- Emphasizes intensifying competition from AWS, Azure and Google Cloud, along with execution challenges and a leveraged balance sheet that could constrain flexibility.
- Argues that while long term prospects are attractive, current expectations on cloud and AI momentum may already be reflected in the price, leaving limited margin of safety.
Between these two Narratives, you can anchor your own view of Oracle’s future growth, risk, and fair value, then decide whether today’s price feels closer to opportunity or optimism.
Do you think there's more to the story for Oracle? Head over to our Community to see what others are saying!

This article by Simply Wall St is general in nature. We provide commentary based on historical data and analyst forecasts only using an unbiased methodology and our articles are not intended to be financial advice. It does not constitute a recommendation to buy or sell any stock, and does not take account of your objectives, or your financial situation. We aim to bring you long-term focused analysis driven by fundamental data. Note that our analysis may not factor in the latest price-sensitive company announcements or qualitative material. Simply Wall St has no position in any stocks mentioned.
Have feedback on this article? Concerned about the content? Get in touch with us directly. Alternatively, email editorial-team@simplywallst.com