
 Nasdaq
 華爾街日報
華爾街日報LICT (LICT) Margin Expansion Reinforces Bullish Narratives Heading Into Q3 2025 Earnings
LICT (LICT) has put another busy quarter on the board, with Q2 2025 revenue of about $34.4 million and net income of $3.2 million translating into basic EPS of roughly $197.6, setting the tone ahead of its Q3 2025 update. The company has seen revenue hover in a tight band from about $33.7 million in Q3 2024 to $34.4 million in Q2 2025, while basic EPS has swung from roughly $227.6 to $197.6 over the same stretch, setting up a results season where investors will be watching how much of the recent profitability can be sustained as margins evolve.
See our full analysis for LICT.With the latest figures on the table, the next step is to weigh these results against the dominant narratives around LICT to see which stories hold up and which might need a rethink.
Curious how numbers become stories that shape markets? Explore Community Narratives
Margins Strengthen With 13.2% Net Profit
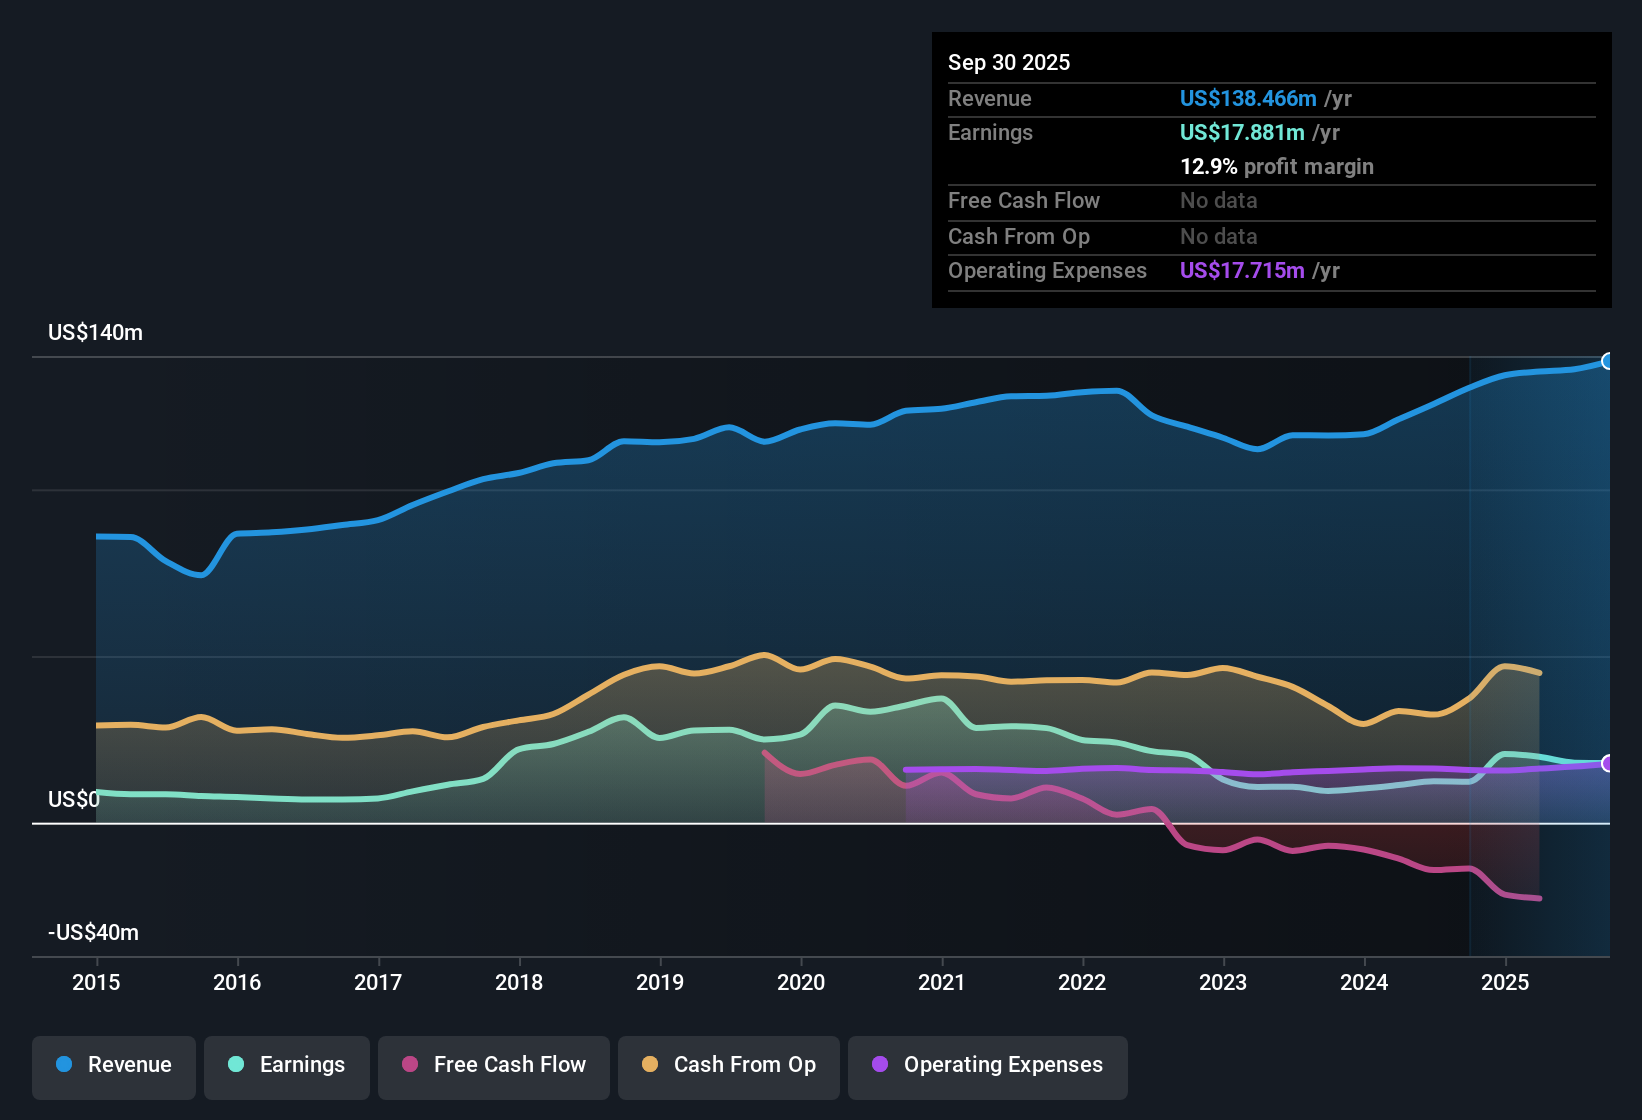
- Over the last 12 months LICT generated $18.0 million of net income on $136.0 million of revenue, giving it a 13.2 percent net profit margin compared with 9.9 percent a year earlier.
- What is striking for a bullish angle is that this higher margin lines up with a 45.1 percent trailing year earnings increase even though recent quarterly net income has moved from $7.0 million in Q4 2024 down to $3.2 million in Q2 2025,
- Supporters can point to the trailing net income trend, from $12.3 million on $130.5 million of revenue in the earlier period to $18.0 million on $136.0 million most recently, as evidence that the business has become more profitable overall.
- At the same time, the step down in quarterly net income from $4.9 million in Q2 2024 and $4.1 million in Q1 2025 to $3.2 million in Q2 2025 shows that even within an improved trailing picture, individual quarters can still be lumpy for a telecom operator.
After a year where profitability improved on paper, some investors are asking whether LICT’s stronger margins can hold if quarterly net income continues to fluctuate.
📊 Read the full LICT Consensus Narrative.Five Year Earnings Slide 21.8 Percent Annually
- Across the last five years LICT’s earnings have declined at an average rate of 21.8 percent per year, a clear contrast to the 45.1 percent earnings growth recorded over just the last 12 months.
- Critics highlight this long term decline as a key bearish point, and the recent numbers give that view plenty of specific data to work with,
- The quarterly pattern from $6.98 million of net income in Q4 2024 to $4.12 million in Q1 2025 and $3.15 million in Q2 2025 illustrates how current profits, while positive, sit below some past peaks and fit with a multi year downtrend.
- This tension between a five year earnings decline and a one year rebound means bears can reasonably question how durable the latest improvement is when the longer history still points in the opposite direction.
P E Of 9.2x Offers Valuation Support
- LICT trades on a price to earnings ratio of 9.2 times, which is below the Global Telecom industry average of 16.2 times, below the broader US market at 18.8 times, and slightly under its peer average of 9.6 times.
- From a more optimistic perspective the relatively low multiple, combined with the higher 13.2 percent trailing margin and 45.1 percent earnings growth over the last year, heavily supports a bullish value case,
- Value focused investors can point to the combination of $136.0 million of trailing revenue and $18.0 million of net income at a 9.2 times multiple as suggesting the market is not paying a premium despite the recent profitability improvement.
- However, the same valuation must be weighed against five year earnings that have fallen 21.8 percent per year, which shows that a cheap P E alone does not remove the need to examine whether the business can stabilize or grow profits from here.
Next Steps
Don't just look at this quarter; the real story is in the long-term trend. We've done an in-depth analysis on LICT's growth and its valuation to see if today's price is a bargain. Add the company to your watchlist or portfolio now so you don't miss the next big move.
See What Else Is Out There
LICT’s sharp five year earnings decline and lumpy recent profits, despite a low P E, raise questions about how reliable its future growth really is.
If you want companies where that uncertainty is dialed down, use our stable growth stocks screener (2088 results) to focus on businesses with steadier earnings trajectories and more predictable performance through market cycles.
This article by Simply Wall St is general in nature. We provide commentary based on historical data and analyst forecasts only using an unbiased methodology and our articles are not intended to be financial advice. It does not constitute a recommendation to buy or sell any stock, and does not take account of your objectives, or your financial situation. We aim to bring you long-term focused analysis driven by fundamental data. Note that our analysis may not factor in the latest price-sensitive company announcements or qualitative material. Simply Wall St has no position in any stocks mentioned.
Have feedback on this article? Concerned about the content? Get in touch with us directly. Alternatively, email editorial-team@simplywallst.com