
 Nasdaq
 華爾街日報
華爾街日報Is Rayonier Now an Opportunity After a 17% Share Price Slide in 2025?
- If you have ever wondered whether Rayonier is quietly turning into a value opportunity or just another lumber REIT stuck in the woods, you are in the right place.
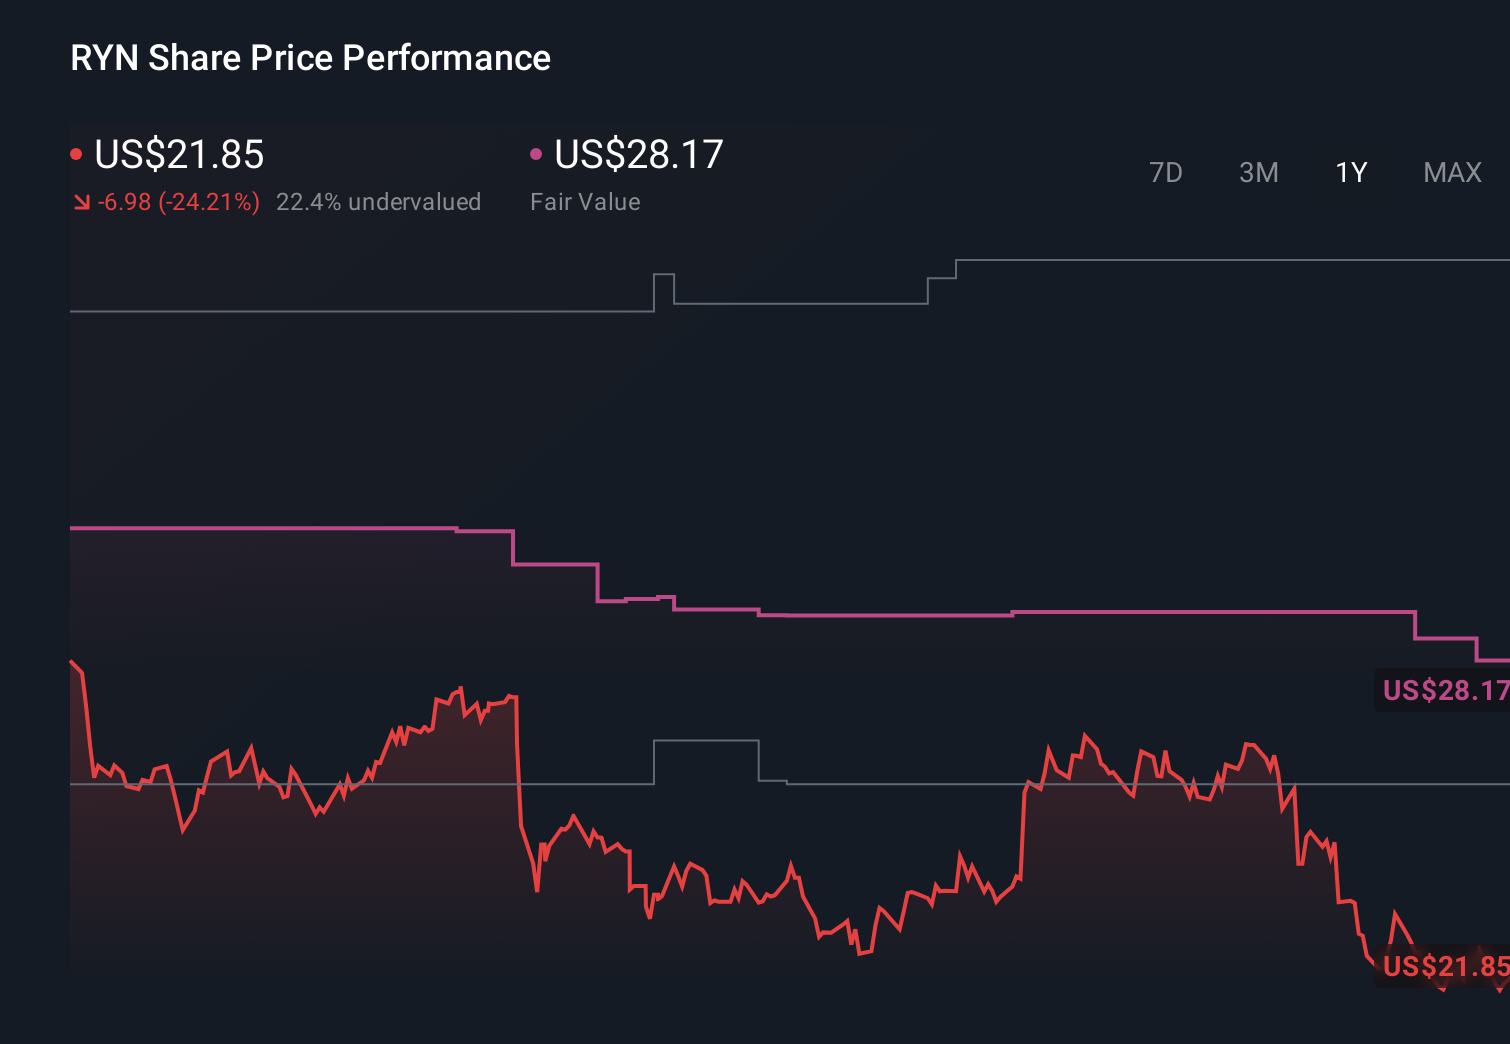
- The stock has slipped to around $21.51, down 17.4% year to date and 17.5% over the last year, even after a small 1.0% bump in the last week and a softer 4.7% drop over the past month.
- That pullback has come as investors reassess timberland and real estate names more broadly, especially with changing expectations around interest rates and long term demand for wood products. Rayonier has also stayed in the conversation thanks to ongoing discussion around the strategic value of its timberland portfolio and its role in long term themes like housing activity and carbon sequestration, which can shift how the market prices its assets.
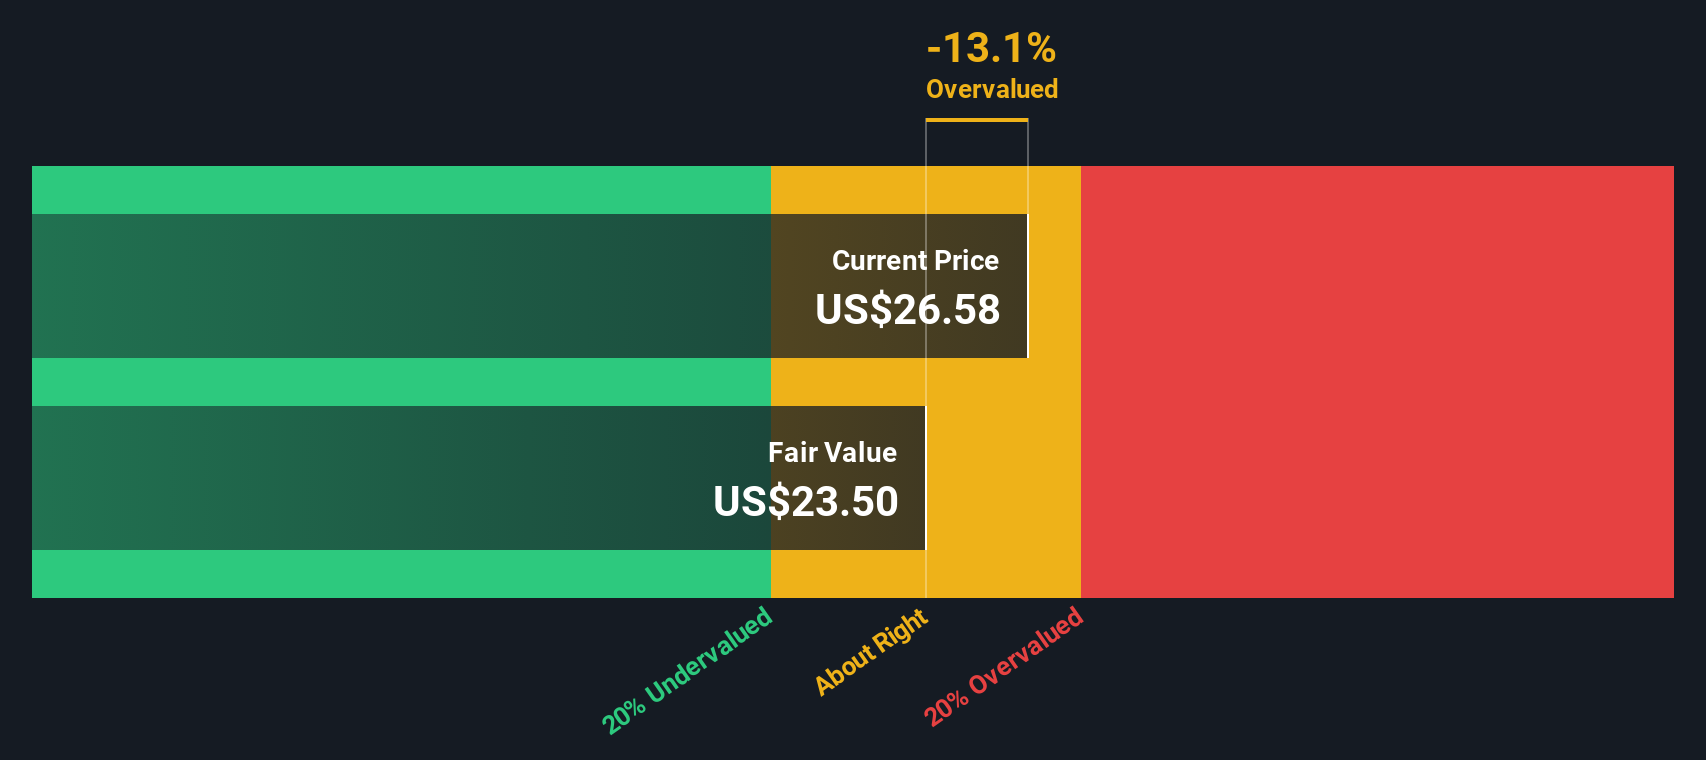
- Despite the weak share price, our valuation framework gives Rayonier a score of 6/6 on our undervaluation checks. We will unpack that score using multiple valuation approaches before exploring an additional way to think about what the stock may be worth.
Find out why Rayonier's -17.5% return over the last year is lagging behind its peers.
Approach 1: Rayonier Discounted Cash Flow (DCF) Analysis
A Discounted Cash Flow model estimates what a business is worth by projecting its future cash flows and discounting them back to today in dollar terms. For Rayonier, the model starts from its latest twelve month free cash flow of about negative $23 million, reflecting a period of heavy investment and timber cycle pressure rather than steady state earnings power.
Analysts expect free cash flow to recover to around $174 million by 2026 and $228 million by 2027, with Simply Wall St extrapolating further growth out to roughly $459 million by 2035 under a two stage Free Cash Flow to Equity framework. These future cash flows are then discounted back to the present, which yields an estimated intrinsic value of about $46.05 per share.
Compared with the recent share price near $21.51, the DCF framework indicates Rayonier is trading at roughly a 53.3% discount to its modeled fair value. This suggests the market is pricing in a much weaker long term cash flow profile than the base case forecast.
Result: UNDERVALUED
Our Discounted Cash Flow (DCF) analysis suggests Rayonier is undervalued by 53.3%. Track this in your watchlist or portfolio, or discover 899 more undervalued stocks based on cash flows.
Approach 2: Rayonier Price vs Earnings
For profitable companies like Rayonier, the price to earnings ratio is a useful yardstick because it links what investors pay directly to the profits the business generates today. The higher the expected growth and the lower the perceived risk, the more investors are usually willing to pay in terms of a higher PE multiple, while slower growth or higher risk tends to justify a lower, more conservative PE.
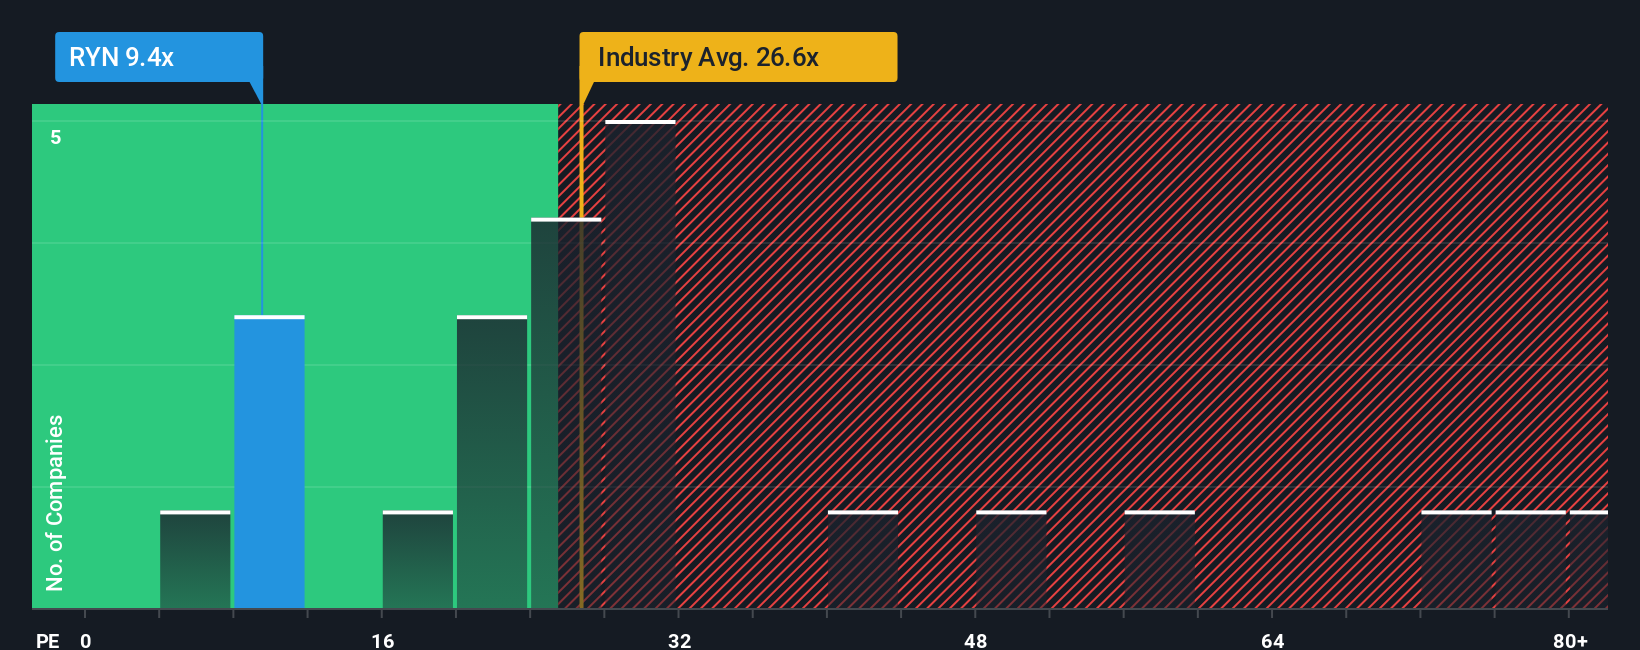
Rayonier currently trades on a PE of about 8.46x, which is well below both the Specialized REITs industry average of roughly 16.75x and the broader peer group average near 34.91x. Simply Wall St’s proprietary Fair Ratio for Rayonier is 17.25x, which is the PE we would expect given its specific mix of earnings growth prospects, industry positioning, profit margins, market cap and risk profile. This Fair Ratio is more informative than a simple comparison with peers or the sector, because it is tailored to Rayonier’s fundamentals rather than assuming it should trade like a “typical” REIT.
With the actual PE of 8.46x sitting well below the 17.25x Fair Ratio, this approach also points to Rayonier looking undervalued on earnings.
Result: UNDERVALUED
PE ratios tell one story, but what if the real opportunity lies elsewhere? Discover 1450 companies where insiders are betting big on explosive growth.
Upgrade Your Decision Making: Choose your Rayonier Narrative
Earlier we mentioned that there is an even better way to understand valuation, so let us introduce you to Narratives, a simple way to attach your own story about Rayonier’s future to concrete numbers like fair value, revenue, earnings and margin forecasts, so that the company’s long term themes, such as renewable energy projects, carbon solutions and climate risks, flow naturally into a financial forecast and then into an explicit fair value per share you can compare against today’s price to decide whether to buy, hold or sell. On Simply Wall St’s Community page, millions of investors use Narratives as an accessible tool that turns their views into structured scenarios, which then update dynamically as new information arrives, such as the latest guidance, news on the PotlatchDeltic merger or changes in analyst estimates. For example, one bullish Rayonier Narrative on the platform might assume strong growth from solar, carbon capture and high value real estate, producing a fair value closer to the top end of analyst targets around $37. A more cautious Narrative that leans into revenue decline, climate exposure and higher required returns might land nearer $27, showing you exactly which assumptions drive the difference.
Do you think there's more to the story for Rayonier? Head over to our Community to see what others are saying!
This article by Simply Wall St is general in nature. We provide commentary based on historical data and analyst forecasts only using an unbiased methodology and our articles are not intended to be financial advice. It does not constitute a recommendation to buy or sell any stock, and does not take account of your objectives, or your financial situation. We aim to bring you long-term focused analysis driven by fundamental data. Note that our analysis may not factor in the latest price-sensitive company announcements or qualitative material. Simply Wall St has no position in any stocks mentioned.
Have feedback on this article? Concerned about the content? Get in touch with us directly. Alternatively, email editorial-team@simplywallst.com