
 Nasdaq
 華爾街日報
華爾街日報Is ABB Still Attractive After Its 190% Five Year Surge And Mixed Valuation Signals?
- If you are wondering whether ABB is still a smart consideration after its strong multi year run, or if you might be late to the party, this breakdown is for you.
- ABB's share price has climbed 2.2% over the last week, 4.6% over the last month, and 19.4% year to date, adding to gains of 16.7% over 1 year, 112.4% over 3 years, and 190.1% over 5 years.
- Behind those moves, ABB has remained in the spotlight for its push into electrification and automation solutions, as well as strategic portfolio tweaks that keep it aligned with long term industrial and energy transition trends. Investors have been responding to this combination of structural growth themes and disciplined capital allocation. This helps explain why the stock has steadily rerated over time.
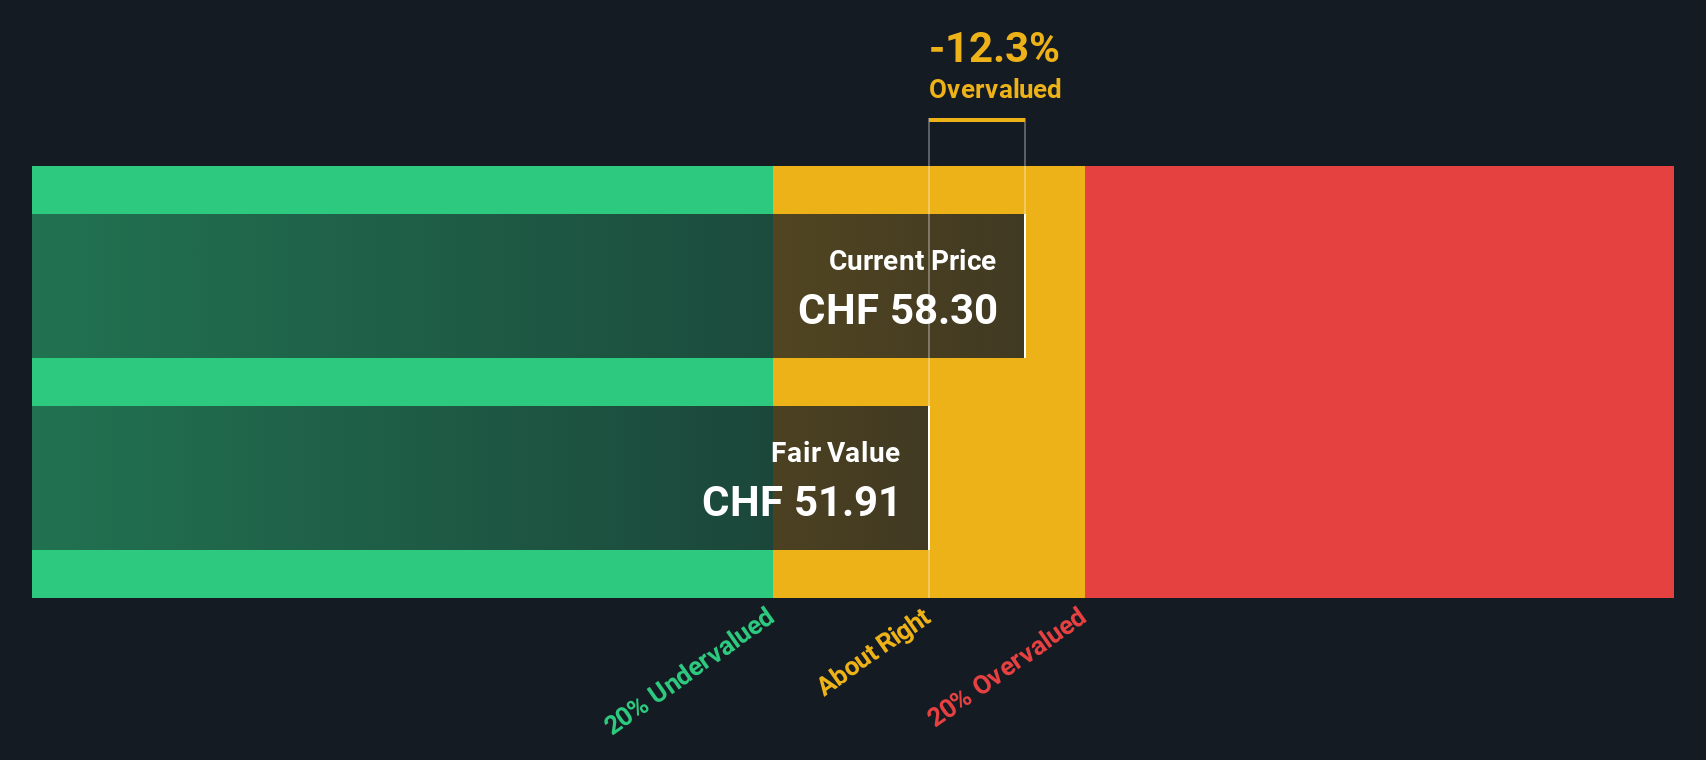
- Yet despite the price strength, ABB only scores 1 out of 6 on our valuation checks. This hints that the market may already be pricing in much of its story, at least by traditional measures. Next we will unpack those valuation approaches in detail, and then finish with a more nuanced way to think about ABB's worth that goes beyond simple multiples and models.
ABB scores just 1/6 on our valuation checks. See what other red flags we found in the full valuation breakdown.
Approach 1: ABB Discounted Cash Flow (DCF) Analysis
A Discounted Cash Flow model estimates the value of a business by projecting the cash it can generate in the future and discounting those cash flows back to their value in today's dollars.
For ABB, the latest twelve month free cash flow is about $4.2 billion. Analysts and Simply Wall St extrapolations see this rising steadily over the coming decade. By 2035, projected free cash flow reaches roughly $6.0 billion, based on a two stage Free Cash Flow to Equity approach that blends explicit analyst forecasts with more modest long term growth assumptions.
When all those future cash flows are discounted back using this DCF framework, the estimated intrinsic value comes out at $44.88 per share. That implies ABB is around 30.7% overvalued relative to its current share price, indicating that a good deal of optimism around electrification and automation growth is already reflected in the valuation.
Result: OVERVALUED
Our Discounted Cash Flow (DCF) analysis suggests ABB may be overvalued by 30.7%. Discover 899 undervalued stocks or create your own screener to find better value opportunities.
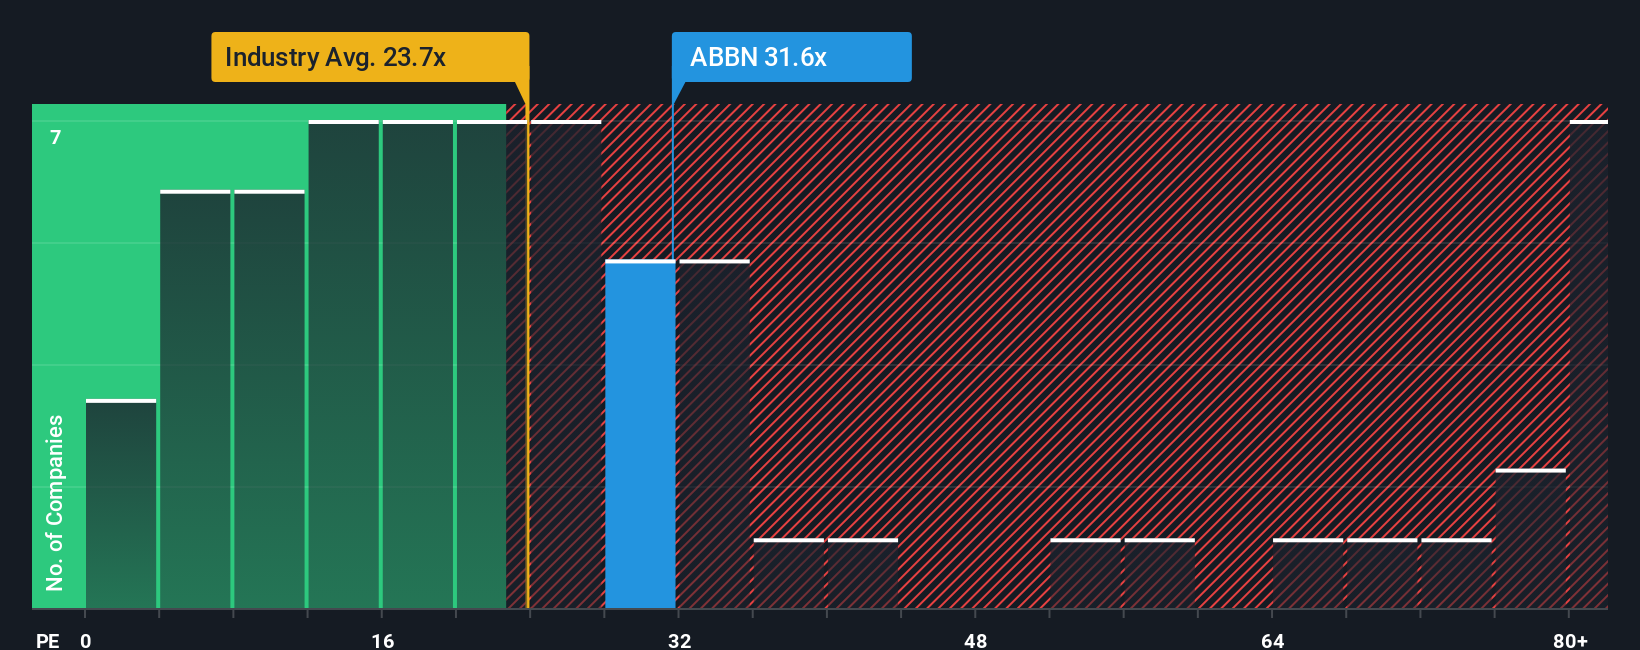
Approach 2: ABB Price vs Earnings
For a mature, profitable business like ABB, the price to earnings ratio is a useful way to gauge how much investors are willing to pay for each unit of current earnings. It naturally captures the market's view on both the sustainability of profits and the outlook for future growth.
In general, faster earnings growth and lower perceived risk justify a higher PE multiple, while slower growth or higher uncertainty should translate into a lower one. ABB currently trades on about 29.8x earnings, roughly in line with the Electrical industry average of around 29.6x and only slightly above peers at about 28.8x. On these simple comparisons, ABB appears broadly fairly valued.
Simply Wall St goes a step further with its proprietary Fair Ratio, which estimates what ABB's PE could be given its earnings growth profile, margins, size, industry characteristics and risk factors. This is more tailored than just comparing ABB to a broad industry or an arbitrary peer set. ABB’s Fair Ratio is calculated at 36.5x, comfortably above its current 29.8x. This indicates the market may not be fully recognising its fundamentals and growth prospects.
Result: Potentially Undervalued
PE ratios tell one story, but what if the real opportunity lies elsewhere? Discover 1450 companies where insiders are betting big on explosive growth.
Upgrade Your Decision Making: Choose your ABB Narrative
Earlier we mentioned that there is an even better way to understand valuation, so let's introduce you to Narratives, a simple framework that lets you turn your view of ABB’s business into a structured story that links the company’s drivers, a financial forecast and a Fair Value estimate you can directly compare to today’s share price.
On Simply Wall St’s Community page, Narratives are an accessible tool used by millions of investors to spell out how they see ABB’s future revenue, earnings and margins, then connect those assumptions to a Fair Value that updates dynamically when new data, news or earnings are released.
This means you are not just reacting to a single PE multiple or DCF output. Instead, you are choosing a Narrative that best matches your conviction and using the gap between its Fair Value and ABB’s current price to decide whether you want to buy, hold or sell.
For example, one optimistic ABB Narrative might assume margins improve faster and justify a Fair Value around CHF 65. A more cautious Narrative that stresses tougher competition and weaker end markets might point to something closer to CHF 37, giving you a clear, side by side sense of potential upside versus downside based on different stories about the same company.
Do you think there's more to the story for ABB? Head over to our Community to see what others are saying!

This article by Simply Wall St is general in nature. We provide commentary based on historical data and analyst forecasts only using an unbiased methodology and our articles are not intended to be financial advice. It does not constitute a recommendation to buy or sell any stock, and does not take account of your objectives, or your financial situation. We aim to bring you long-term focused analysis driven by fundamental data. Note that our analysis may not factor in the latest price-sensitive company announcements or qualitative material. Simply Wall St has no position in any stocks mentioned.
Have feedback on this article? Concerned about the content? Get in touch with us directly. Alternatively, email editorial-team@simplywallst.com