
 Nasdaq
 華爾街日報
華爾街日報Is Textron Still Attractively Priced After Strong Multi Year Share Price Gains?
- Wondering whether Textron is still a smart buy at today’s price, or if most of the upside is already baked in? This breakdown will help you decide with a cool head.
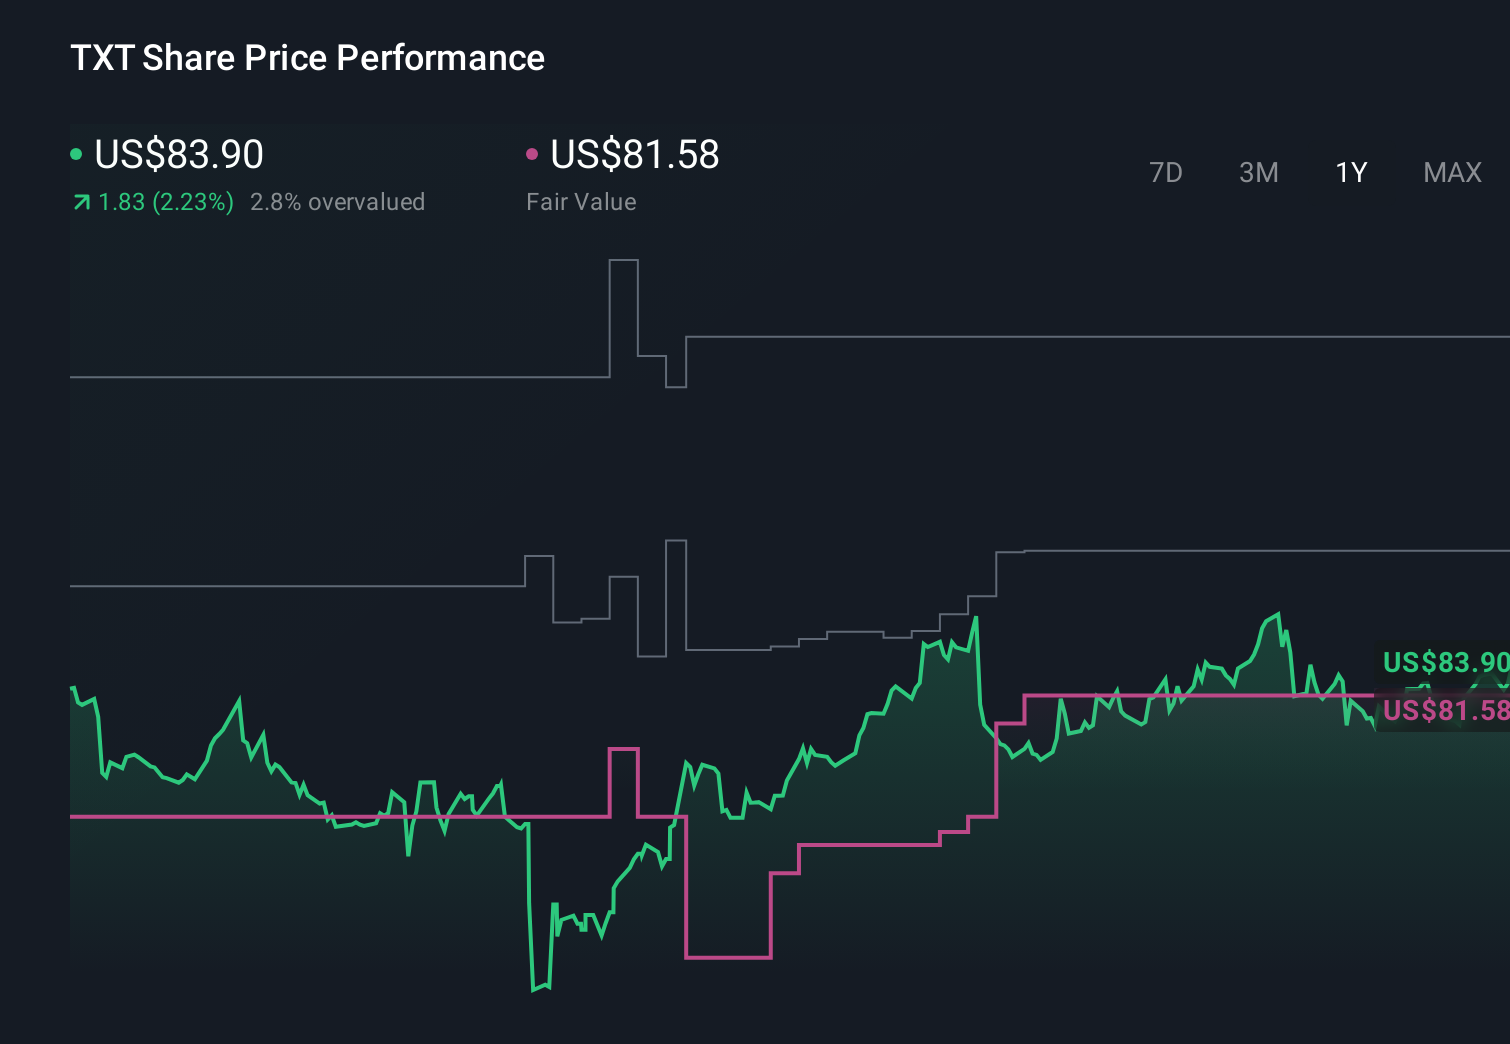
- The stock has quietly climbed 1.8% over the last week and 2.3% over the past month, adding to a 10.7% gain year to date and a strong 75.5% over five years, which naturally raises the question of how much value is left on the table.
- Recent news has focused on Textron’s growing defense and aviation footprint, from expanding military aircraft programs to ongoing interest in its specialized business jets. This has reinforced the long term demand story for its portfolio. At the same time, investors are paying closer attention to how its capital allocation and backlog trends could support future cash flows, helping to explain the more measured share price moves over the last year.
- On our framework, Textron currently scores a solid 5 out of 6 on undervaluation checks, which puts it firmly on the value radar but not without a few question marks. Next, we will unpack what different valuation approaches are saying about Textron today, and then circle back to an even better way of thinking about its true worth that ties all these methods together.
Find out why Textron's 2.3% return over the last year is lagging behind its peers.
Approach 1: Textron Discounted Cash Flow (DCF) Analysis
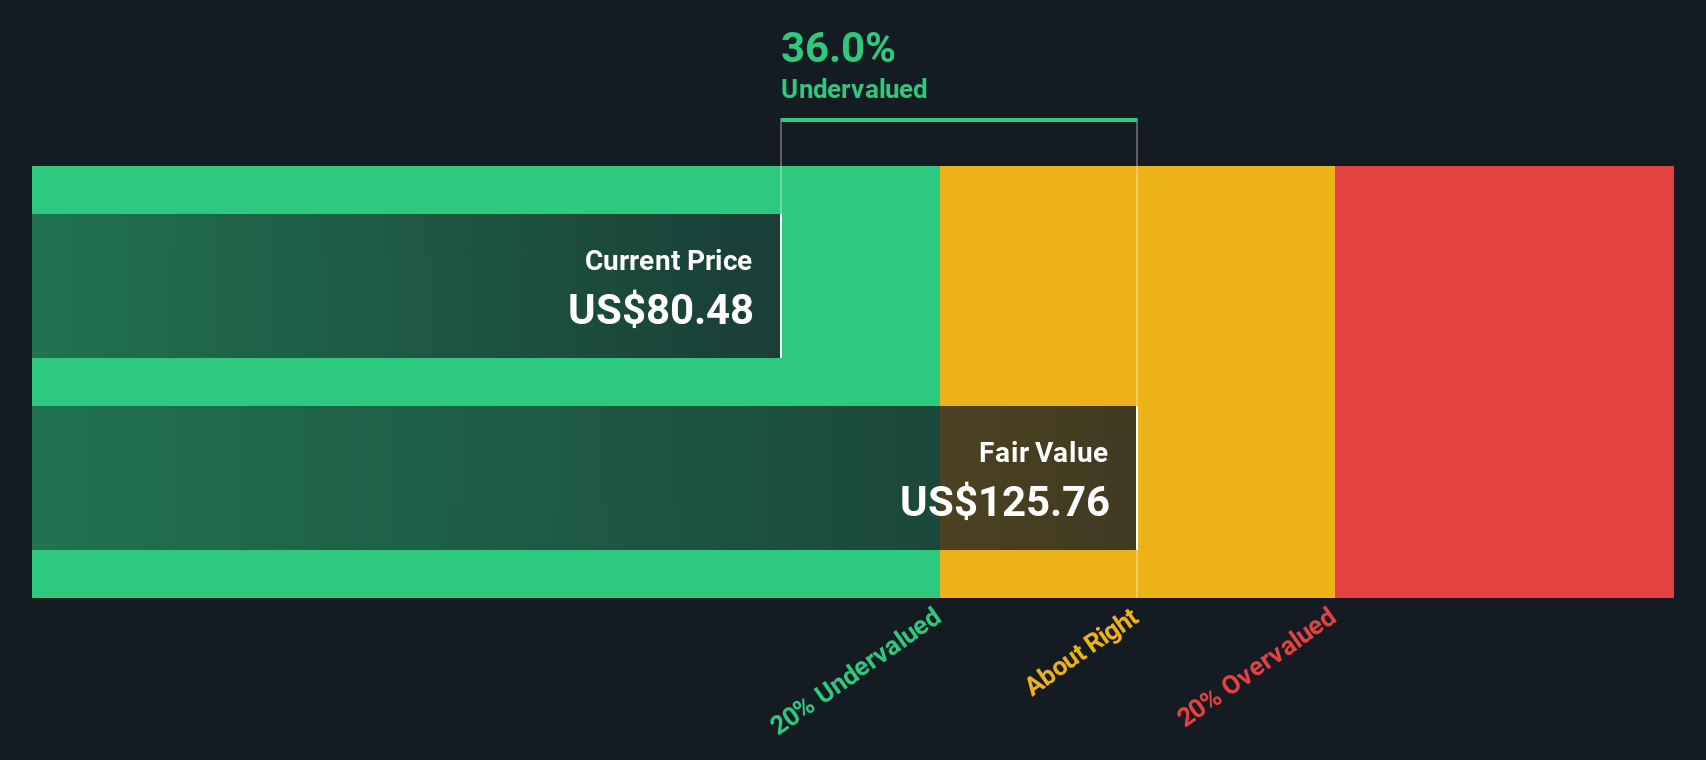
A Discounted Cash Flow, or DCF, model takes Textron’s expected future cash flows and discounts them back to today in dollar terms to estimate what the whole business is worth now. In this case, the model uses a 2 Stage Free Cash Flow to Equity approach, starting from last twelve months free cash flow of about $668.8 million and projecting how that could grow over time.
Analysts provide detailed forecasts for the next few years, with free cash flow expected to rise to just over $1.0 billion by 2026. Beyond that, Simply Wall St extrapolates a moderating growth path, reaching around $1.58 billion of free cash flow by 2035 as the business matures. All of these future cash flows are discounted back to today to arrive at an estimated intrinsic value of roughly $135.80 per share.
Compared with the current share price, this implies Textron is trading at about a 38.2% discount to its DCF based fair value, suggesting the market is not fully pricing in its projected cash generation.
Result: UNDERVALUED
Our Discounted Cash Flow (DCF) analysis suggests Textron is undervalued by 38.2%. Track this in your watchlist or portfolio, or discover 905 more undervalued stocks based on cash flows.
Approach 2: Textron Price vs Earnings
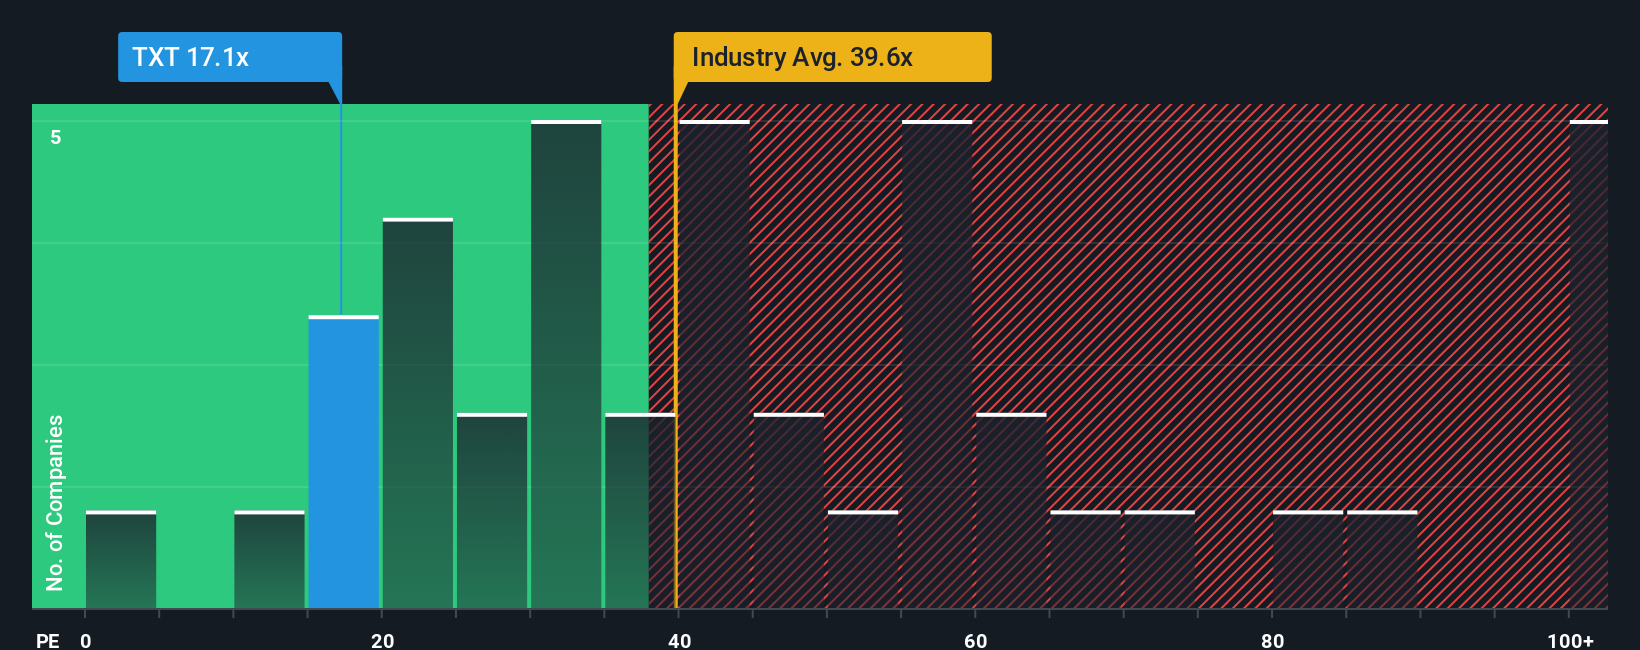
For profitable companies like Textron, the price to earnings ratio, or PE, is often the most intuitive way to think about valuation because it directly links what investors are paying to the profits the business is generating today. A higher PE generally reflects stronger growth expectations and lower perceived risk, while slower growth or higher uncertainty typically justify a lower, more conservative multiple.
Textron currently trades on a PE of about 17.86x, which is meaningfully below both the Aerospace and Defense industry average of around 37.13x and the peer group average near 35.26x. On the surface, that discount might suggest an attractive entry point, but raw comparisons can be misleading if the company has different growth prospects, margins or risk profile than its rivals.
That is where Simply Wall St’s Fair Ratio comes in. This proprietary metric estimates what a reasonable PE should be, given Textron’s earnings growth outlook, profitability, risk factors, industry and market cap. For Textron, the Fair Ratio is 23.30x, comfortably above the current 17.86x. This gap implies the market is pricing the stock below what its fundamentals and risk profile would typically warrant, which may point to further valuation upside if execution stays on track.
Result: UNDERVALUED
PE ratios tell one story, but what if the real opportunity lies elsewhere? Discover 1450 companies where insiders are betting big on explosive growth.
Upgrade Your Decision Making: Choose your Textron Narrative
Earlier we mentioned that there is an even better way to understand valuation, so let us introduce you to Narratives, a simple way to put a clear story behind the numbers you are using for Textron’s fair value, future revenue, earnings and margins.
A Narrative connects what you believe about a company, for example which aircraft programs will win, how margins will evolve, or how resilient demand will be, to a structured financial forecast and then to a fair value estimate that you can compare to today’s share price.
On Simply Wall St, Narratives live in the Community page and are designed to be easy to use, letting millions of investors quickly build, adjust and compare their own scenarios to decide whether Textron looks like a buy, hold or sell as the gap between Fair Value and Price widens or narrows.
Because these Narratives update dynamically when new information such as earnings, contract wins or cost setbacks arrive, you can see in real time how a more optimistic view that Textron should trade closer to $107 versus a cautious view around $82 leads to very different buy or sell decisions.
Do you think there's more to the story for Textron? Head over to our Community to see what others are saying!
This article by Simply Wall St is general in nature. We provide commentary based on historical data and analyst forecasts only using an unbiased methodology and our articles are not intended to be financial advice. It does not constitute a recommendation to buy or sell any stock, and does not take account of your objectives, or your financial situation. We aim to bring you long-term focused analysis driven by fundamental data. Note that our analysis may not factor in the latest price-sensitive company announcements or qualitative material. Simply Wall St has no position in any stocks mentioned.
Have feedback on this article? Concerned about the content? Get in touch with us directly. Alternatively, email editorial-team@simplywallst.com