
 Nasdaq
 華爾街日報
華爾街日報Is Biogen’s Recent 20% Rally Just the Start as Valuation Signals Turn Attractive?
- Wondering if Biogen is quietly becoming a bargain again, or if the market still has it priced like yesterday's story? This breakdown will walk you through what the numbers are really saying about its value.
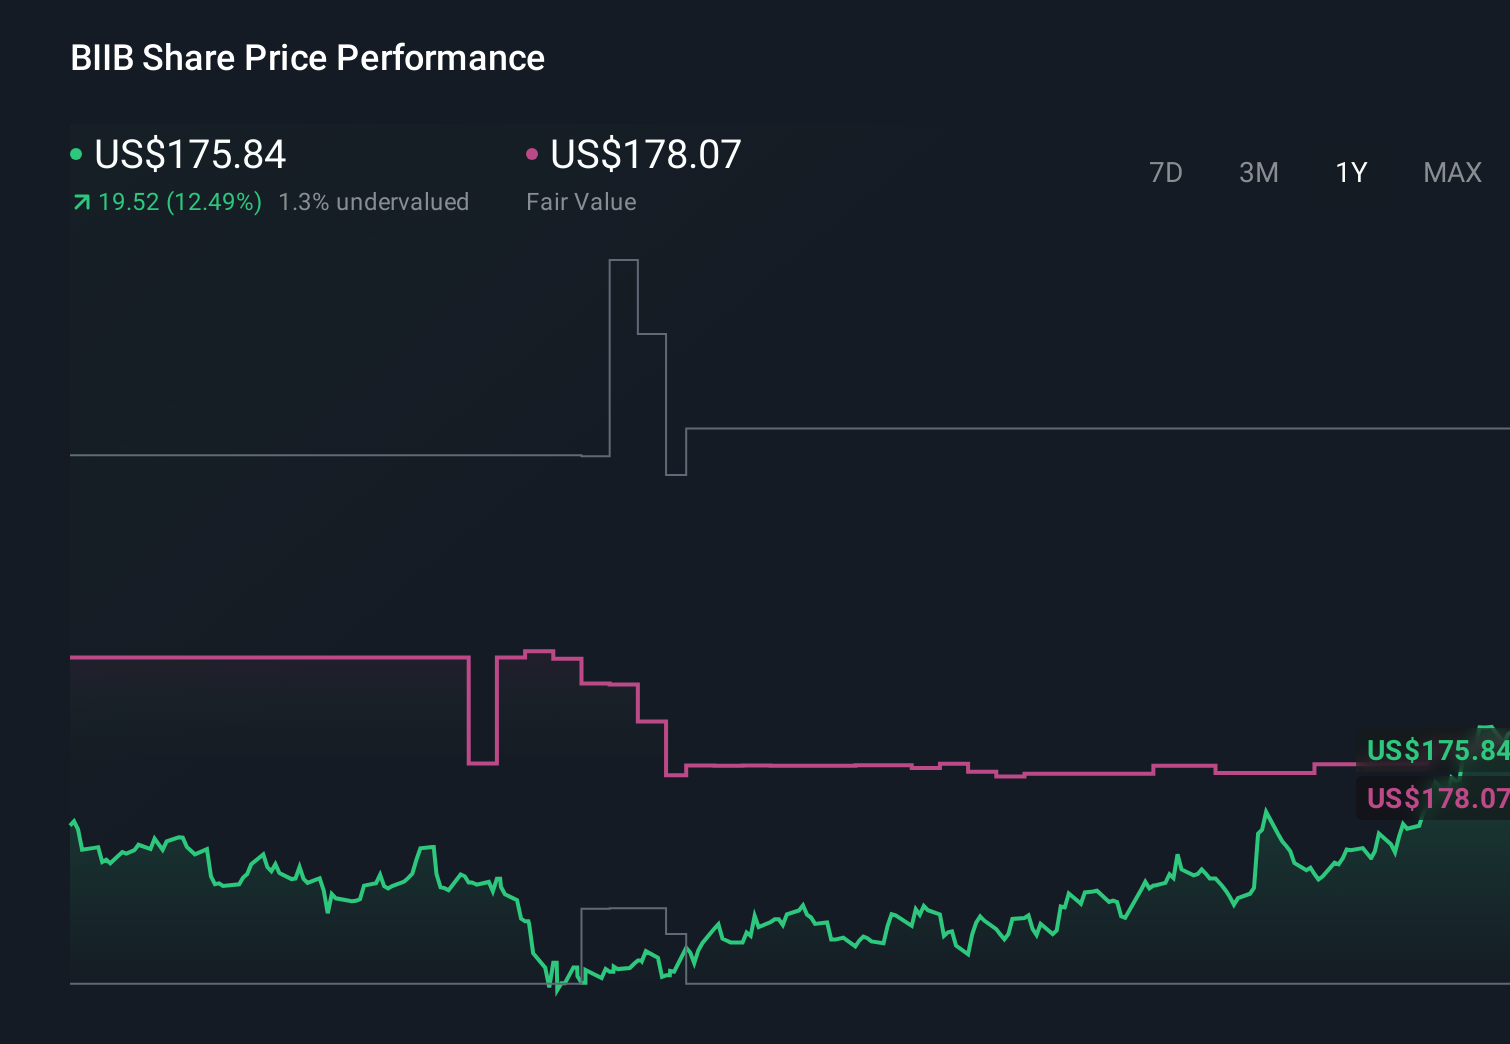
- After a tough few years, the stock has started to show signs of life, with shares up around 1.5% over the last week, 16.0% over the past month, and 20.3% year to date, even though the 3-year and 5-year returns remain negative.
- Recent moves have been driven by shifting sentiment around Biogen's neurology and Alzheimer's portfolio, as investors reassess the long-term commercial potential of its pipeline and partnerships. At the same time, changing expectations around competition in neurodegenerative disease and the regulatory landscape have added both excitement and uncertainty, giving context to the stock's rebound.
- On our framework, Biogen scores a solid 5/6 valuation score. This suggests it screens as undervalued on most of the key checks we run. Next, we will unpack those methods, before ending with a more holistic way to think about what Biogen is really worth.
Find out why Biogen's 15.3% return over the last year is lagging behind its peers.
Approach 1: Biogen Discounted Cash Flow (DCF) Analysis
A Discounted Cash Flow model estimates what a company is worth by projecting the cash it can generate in the future and then discounting those cash flows back to today in dollar terms.
For Biogen, the model starts with last twelve months free cash flow of about $2.18 billion and uses analyst forecasts for the next few years, then extends those trends further out. By 2029, annual free cash flow is projected to be roughly $2.61 billion, with ten year projections gradually climbing toward around $2.95 billion by 2035 as the business matures. Beyond the explicit analyst horizon, Simply Wall St extrapolates cash flows using a 2 Stage Free Cash Flow to Equity approach.
When all those future cash flows are discounted back to today, the model produces an estimated intrinsic value of about $368.96 per share. Compared with the current market price, this implies Biogen is trading at roughly a 51.1% discount, indicating that the shares may be undervalued if the cash flow projections and assumptions prove accurate.
Result: UNDERVALUED
Our Discounted Cash Flow (DCF) analysis suggests Biogen is undervalued by 51.1%. Track this in your watchlist or portfolio, or discover 906 more undervalued stocks based on cash flows.

Approach 2: Biogen Price vs Earnings
For profitable companies like Biogen, the price to earnings ratio is often a straightforward way to gauge whether investors are paying a reasonable price for each dollar of profit. A higher PE can be justified when the market expects stronger growth or sees the business as relatively low risk. In contrast, slower growth or higher uncertainty usually calls for a lower, more conservative multiple.
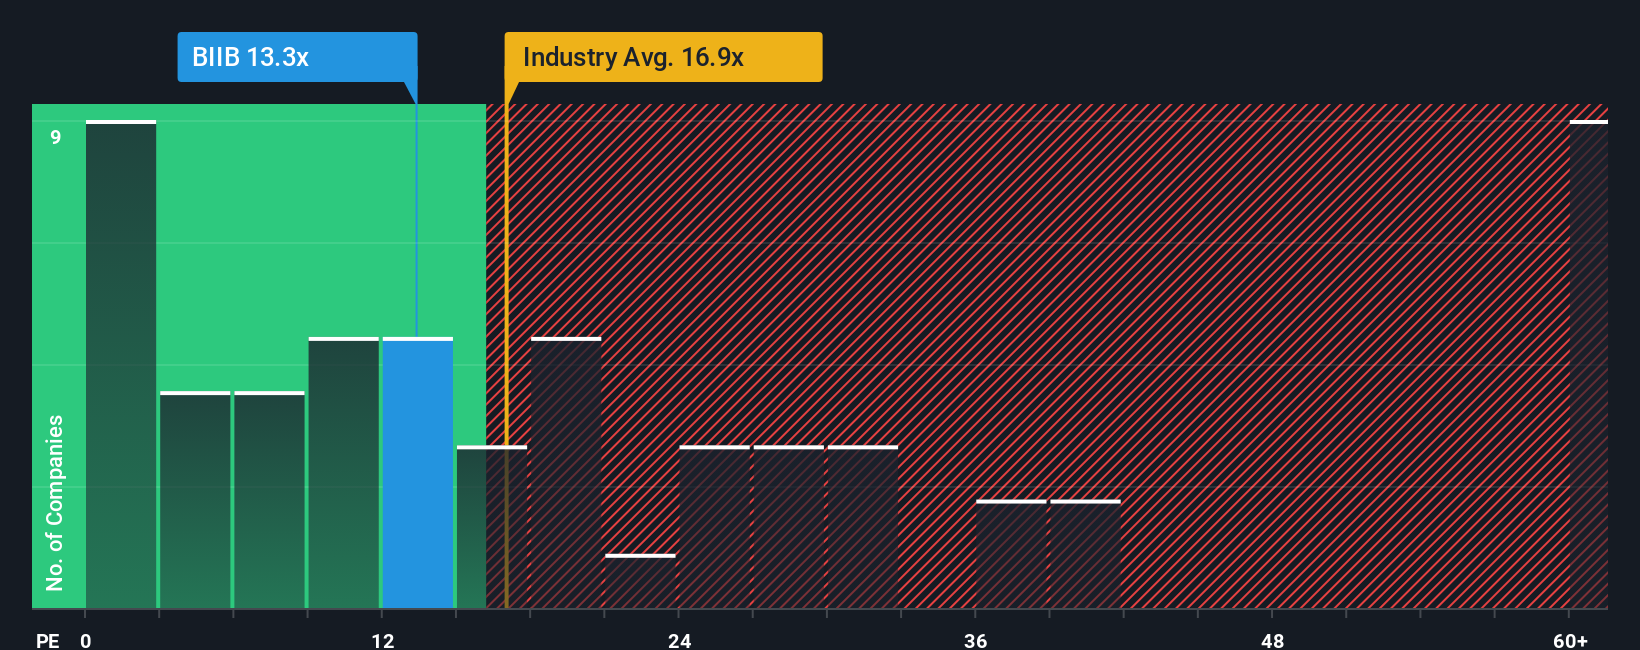
Biogen currently trades on a PE of about 16.5x, which is below both the broader Biotechs industry average of roughly 19.1x and the peer group average of around 21.3x. Simply Wall St also calculates a proprietary Fair Ratio for Biogen of about 23.3x. This is the PE level the company might deserve based on its specific earnings growth outlook, margins, industry, size and risk profile. This Fair Ratio offers a more tailored benchmark than a simple comparison with peers or the sector because it adjusts for Biogen’s own fundamentals rather than assuming all biotech names should trade on the same multiple. On that basis, Biogen’s current PE sits well below its Fair Ratio, suggesting the market is not fully recognizing its earnings potential.
Result: UNDERVALUED
PE ratios tell one story, but what if the real opportunity lies elsewhere? Discover 1450 companies where insiders are betting big on explosive growth.
Upgrade Your Decision Making: Choose your Biogen Narrative
Earlier we mentioned that there is an even better way to understand valuation, so let us introduce you to Narratives, which are simply your own story about Biogen linked directly to numbers like future revenue, earnings, margins, and what you think its fair value should be. A Narrative connects three pieces in one place: the business story you believe, the financial forecast that flows from that story, and the fair value that falls out of those assumptions. On Simply Wall St, millions of investors explore and create Narratives on the Community page, making this a very accessible tool rather than something only professionals can use. Narratives then help you decide when to buy or sell by constantly comparing your Fair Value to the current market price and updating that view dynamically whenever new information, such as earnings or drug trial news, comes in. For Biogen, one investor might build a bullish Narrative that leans into strong LEQEMBI adoption and higher earnings, while another might model slower growth and more pricing pressure, leading to very different fair values and very different decisions on whether today’s price looks attractive or not.
Do you think there's more to the story for Biogen? Head over to our Community to see what others are saying!
This article by Simply Wall St is general in nature. We provide commentary based on historical data and analyst forecasts only using an unbiased methodology and our articles are not intended to be financial advice. It does not constitute a recommendation to buy or sell any stock, and does not take account of your objectives, or your financial situation. We aim to bring you long-term focused analysis driven by fundamental data. Note that our analysis may not factor in the latest price-sensitive company announcements or qualitative material. Simply Wall St has no position in any stocks mentioned.
Have feedback on this article? Concerned about the content? Get in touch with us directly. Alternatively, email editorial-team@simplywallst.com