
 Nasdaq
 華爾街日報
華爾街日報Weighing Primo Brands Valuation After 9.1% Rebound and Strategic Refocus in 2025
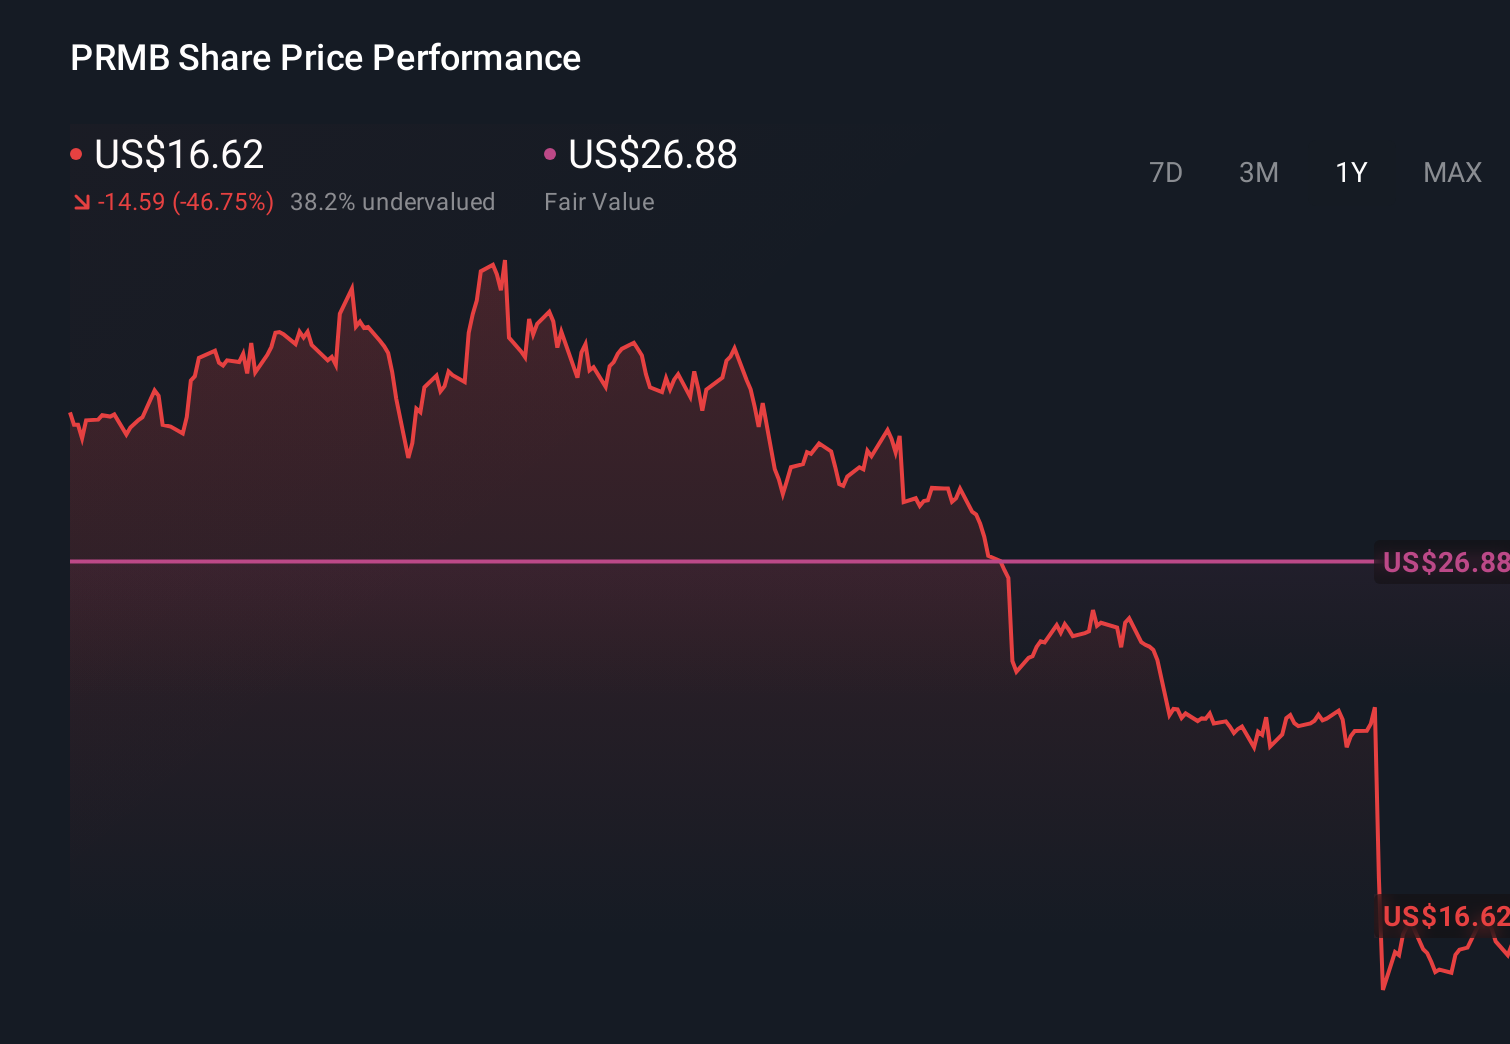
- If you are wondering whether Primo Brands at around $15.77 is a bargain or a value trap, you are not alone. This stock has all the ingredients of a classic valuation puzzle.
- Over the last month the share price has climbed roughly 9.1%, even though it is still down 49.1% year to date and 47.7% over the last year. This suggests that sentiment is shifting, but the long-term scars are still visible.
- That recent rebound has come as investors digested a series of strategic updates, including management commentary about sharpening the company focus on its core beverage brands and ongoing cost discipline across the portfolio. At the same time, sector wide discussion about consumer staples resilience has put renewed attention on names like Primo Brands, which helps explain the tug of war currently visible in the share price.
- On our checks the stock scores a 5 out of 6 valuation score, suggesting it screens as undervalued on most metrics. Next we will examine those different valuation approaches before finishing with a more complete way to think about what Primo Brands might be worth.
Find out why Primo Brands's -47.7% return over the last year is lagging behind its peers.
Approach 1: Primo Brands Discounted Cash Flow (DCF) Analysis
A Discounted Cash Flow, or DCF, model estimates what a business is worth today by projecting the cash it can generate in the future, then discounting those cash flows back to a present value. For Primo Brands, the model used is a 2 Stage Free Cash Flow to Equity approach, which allows for faster growth in the near term and steadier expansion further out.
The company generated roughly $275.3 Million in free cash flow over the last twelve months. Analyst and model projections have this rising to around $1.10 Billion by 2029, with further incremental growth implied over the following years. These later years rely more heavily on extrapolations rather than direct analyst estimates, so they should be treated as indicative rather than precise.
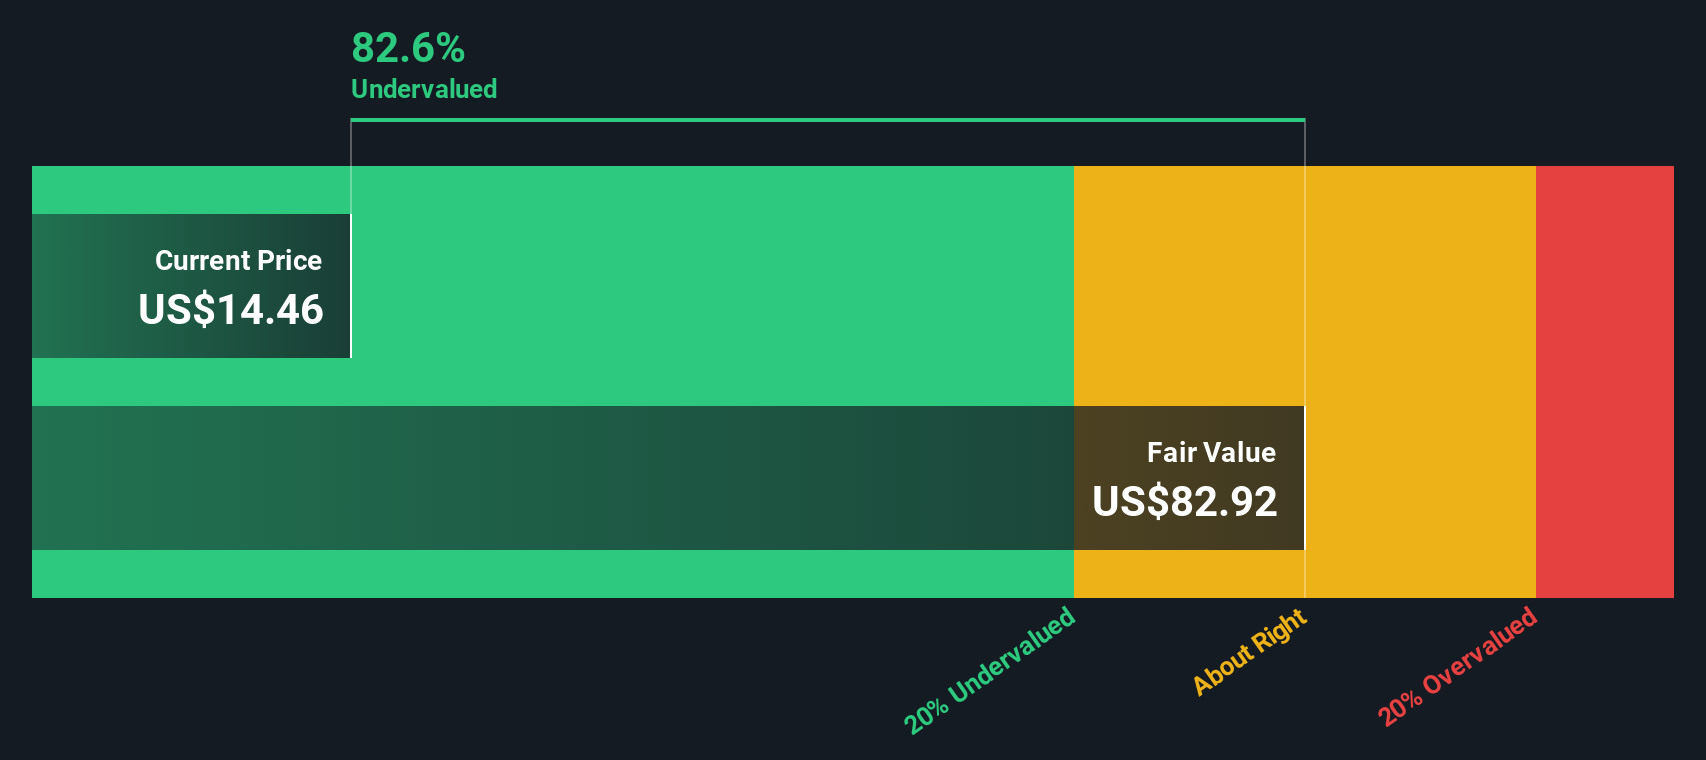
Aggregating and discounting those projected cash flows yields an estimated intrinsic value of about $75.17 per share. Compared with the current share price near $15.77, the DCF implies the stock is about 79.0% undervalued. This indicates that the market may be heavily discounting Primo Brands future cash generation.
Result: UNDERVALUED
Our Discounted Cash Flow (DCF) analysis suggests Primo Brands is undervalued by 79.0%. Track this in your watchlist or portfolio, or discover 906 more undervalued stocks based on cash flows.
Approach 2: Primo Brands Price vs Sales
For consumer companies like Primo Brands, revenue is often a steadier indicator than earnings in any single year. This makes the Price to Sales, or P S, multiple a useful yardstick. Investors typically pay higher sales multiples for businesses with stronger growth prospects and lower risk, while slower growing or more cyclical names usually trade at a discount.
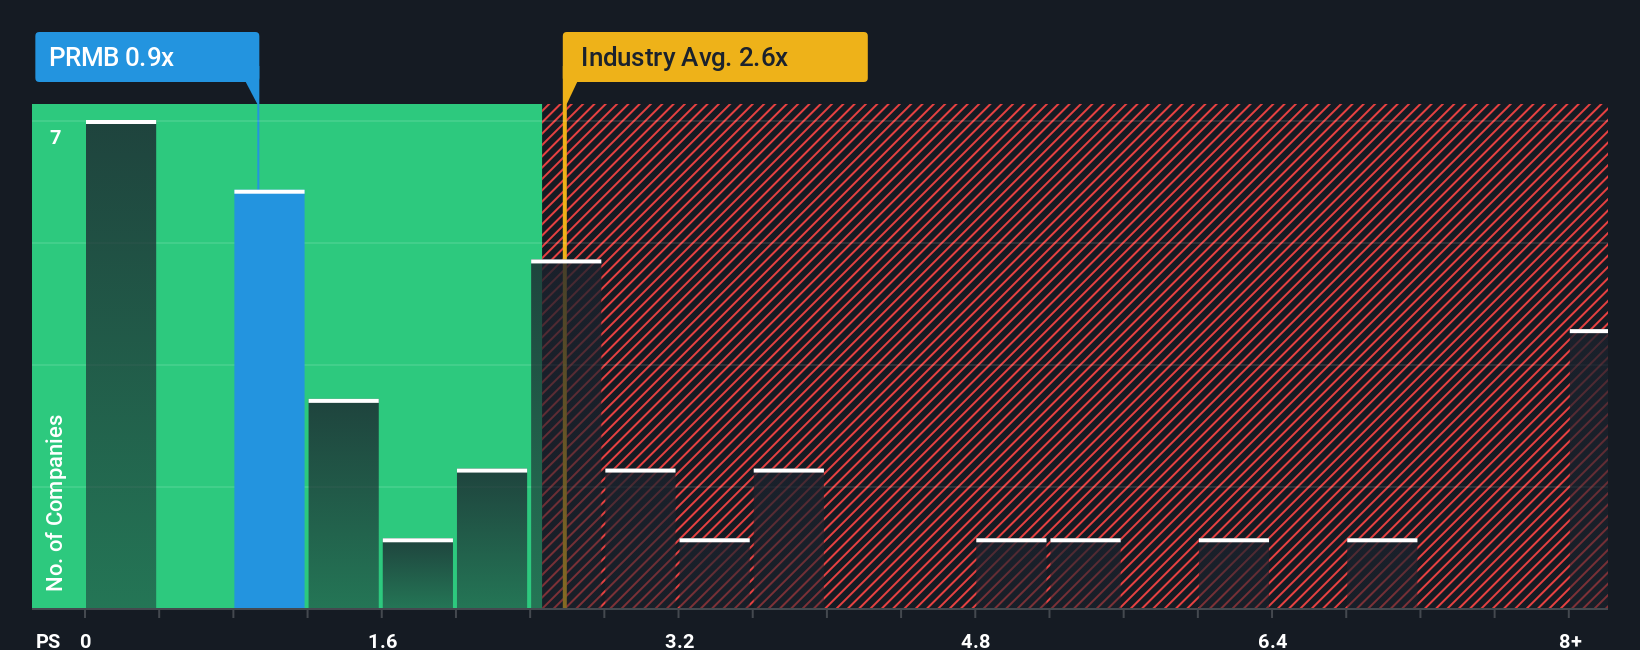
Primo Brands currently trades on a P S ratio of about 0.89x. That sits well below both the Beverage industry average of roughly 2.31x and a broader peer group nearer 3.74x, implying the market is assigning the company a sizable discount to comparable names. Simply Wall St also calculates a proprietary “Fair Ratio” of 1.11x for Primo Brands, which reflects what its sales multiple might be given its growth profile, margins, industry positioning, market cap and risk factors.
This Fair Ratio is more tailored than a simple comparison to peers or the industry because it adjusts for company specific strengths and weaknesses, rather than assuming all beverage stocks deserve the same treatment. With the actual P S multiple at 0.89x versus a Fair Ratio of 1.11x, Primo Brands screens as undervalued on this metric.
Result: UNDERVALUED
PS ratios tell one story, but what if the real opportunity lies elsewhere? Discover 1450 companies where insiders are betting big on explosive growth.
Upgrade Your Decision Making: Choose your Primo Brands Narrative
Earlier we mentioned that there is an even better way to understand valuation, so let us introduce you to Narratives. Narratives are the story you tell about a company that sits behind your numbers, including your assumed fair value and your estimates for future revenue, earnings and margins.
A Narrative ties Primo Brands business story to a concrete financial forecast, and then to a fair value per share, so you can clearly see how your expectations about brand strength, pricing power and cost control translate into the numbers.
On Simply Wall St, Narratives are an easy, accessible tool on the Community page. Millions of investors share their outlooks, track how those outlooks map into forecasts and see an implied fair value they can compare to the current share price to decide whether Primo Brands looks like a buy, hold or sell.
Because Narratives update dynamically when new information arrives, such as earnings releases, guidance changes or major news, they stay aligned with reality. You can quickly compare, for example, a very optimistic Primo Brands Narrative with a high fair value to a cautious Narrative with a much lower fair value to understand why other investors see the stock differently.
Do you think there's more to the story for Primo Brands? Head over to our Community to see what others are saying!
This article by Simply Wall St is general in nature. We provide commentary based on historical data and analyst forecasts only using an unbiased methodology and our articles are not intended to be financial advice. It does not constitute a recommendation to buy or sell any stock, and does not take account of your objectives, or your financial situation. We aim to bring you long-term focused analysis driven by fundamental data. Note that our analysis may not factor in the latest price-sensitive company announcements or qualitative material. Simply Wall St has no position in any stocks mentioned.
Have feedback on this article? Concerned about the content? Get in touch with us directly. Alternatively, email editorial-team@simplywallst.com