
 Nasdaq
 華爾街日報
華爾街日報Emerging Opportunities in Asia Featuring Three Undiscovered Gems
As global markets grapple with mixed economic signals, the Asian market continues to present unique opportunities, particularly within its small-cap sector. With investor sentiment buoyed by hopes of interest rate cuts and a notable focus on technology and innovation, identifying promising stocks in this dynamic region requires a keen understanding of local economic trends and growth potential.
Top 10 Undiscovered Gems With Strong Fundamentals In Asia
| Name | Debt To Equity | Revenue Growth | Earnings Growth | Health Rating |
|---|---|---|---|---|
| Jetwell Computer | 34.75% | 16.24% | 27.51% | ★★★★★★ |
| Sinopower Semiconductor | NA | 0.10% | -10.24% | ★★★★★★ |
| Shindaeyang Paper | 10.96% | 0.53% | -8.77% | ★★★★★★ |
| VICOM | NA | 6.95% | 4.06% | ★★★★★★ |
| Central Forest Group | NA | 5.20% | 24.71% | ★★★★★★ |
| AzureWave Technologies | 11.00% | -1.30% | 12.72% | ★★★★★★ |
| OpenWork | NA | 30.11% | 29.99% | ★★★★★★ |
| MNtech | 69.81% | 10.24% | -13.03% | ★★★★★☆ |
| TSTE | 37.68% | 4.91% | -5.78% | ★★★★★☆ |
| Marusan Securities | 3.64% | 0.57% | 3.44% | ★★★★☆☆ |
Let's explore several standout options from the results in the screener.
Chongqing Zaisheng Technology (SHSE:603601)
Simply Wall St Value Rating: ★★★★★☆
Overview: Chongqing Zaisheng Technology Co., Ltd. is engaged in the research, manufacturing, and marketing of fiber cotton in China, with a market cap of CN¥6.52 billion.
Operations: Zaisheng Technology generates revenue primarily from its fiber cotton products. The company has a market cap of CN¥6.52 billion, reflecting its financial standing in the industry.
Chongqing Zaisheng Technology, a promising player in the Chemicals sector, has shown remarkable earnings growth of 591.4% over the past year, significantly outpacing the industry's 7.5%. Despite a one-off gain of CN¥23 million impacting recent results, it trades at an appealing 77.4% below estimated fair value. The company's debt to equity ratio increased from 13.9% to 19.4% over five years but remains manageable with EBIT covering interest payments by 9.3 times. While sales for nine months ending September dipped to CNY985 million from CNY1 billion last year, profitability and strategic positioning suggest potential for future growth.
Jinzi HamLtd (SZSE:002515)
Simply Wall St Value Rating: ★★★★★★
Overview: Jinzi Ham Co., Ltd. focuses on the research and development, production, and sale of ham and meat products both in China and internationally, with a market capitalization of CN¥8.55 billion.
Operations: The company's revenue primarily stems from its ham and meat product sales in both domestic and international markets. It operates with a market capitalization of CN¥8.55 billion.
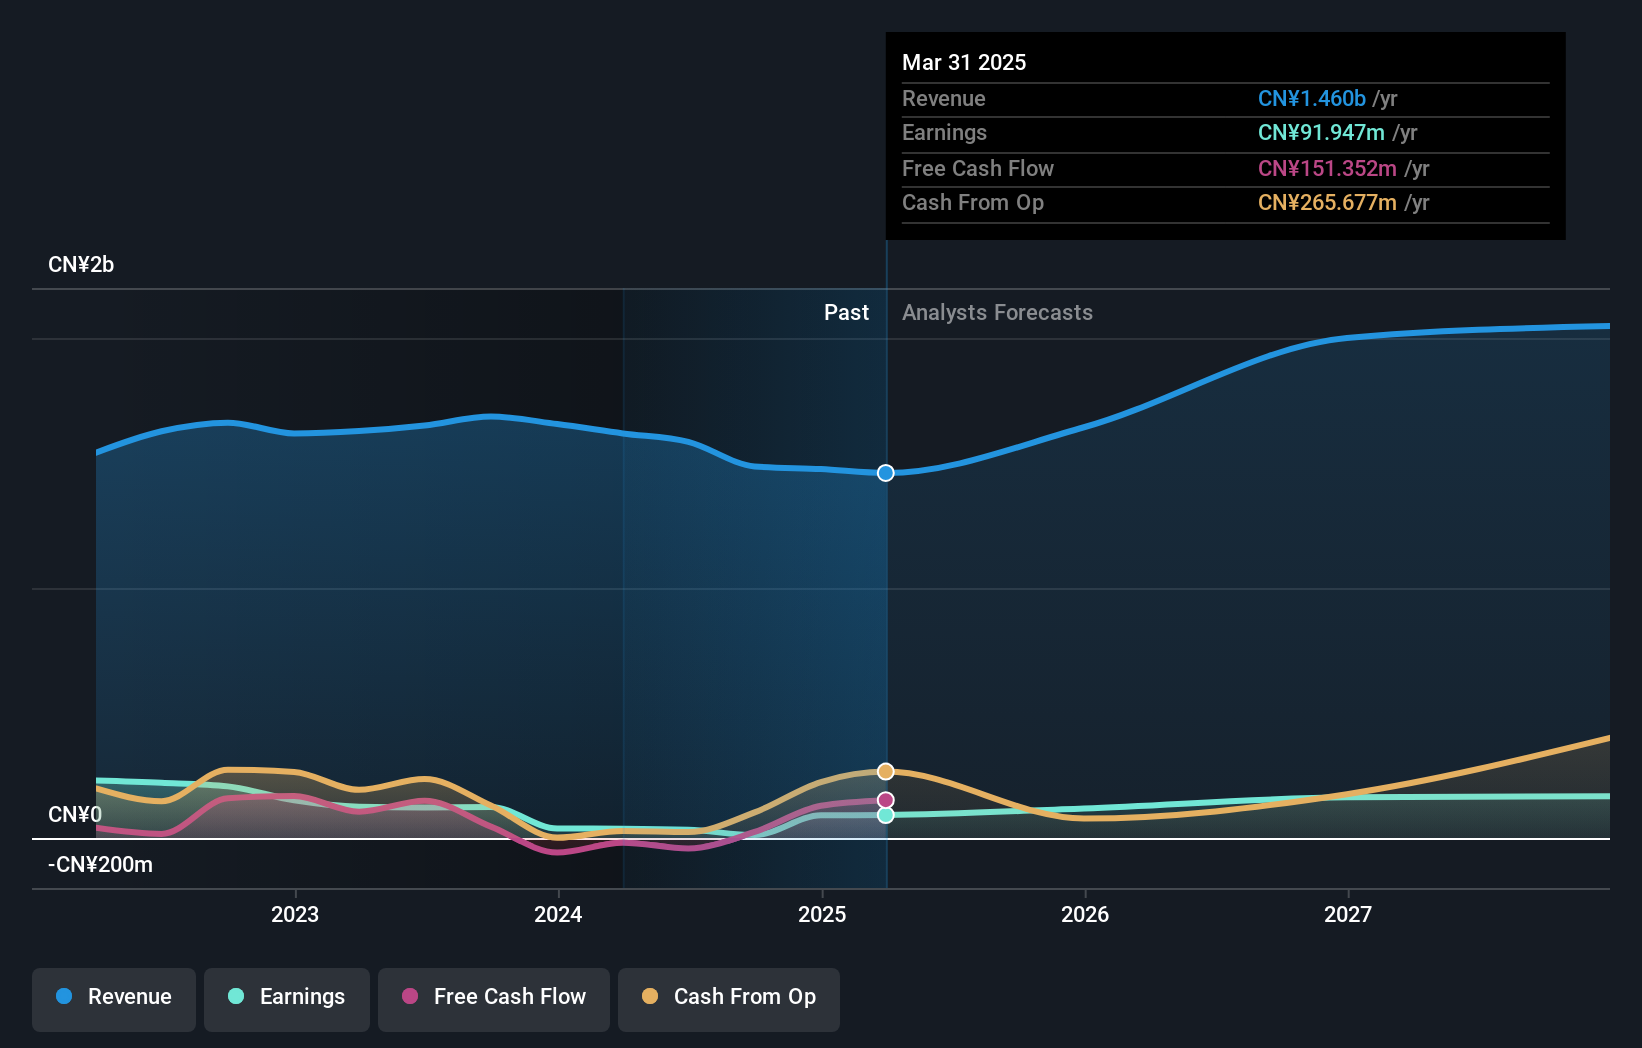
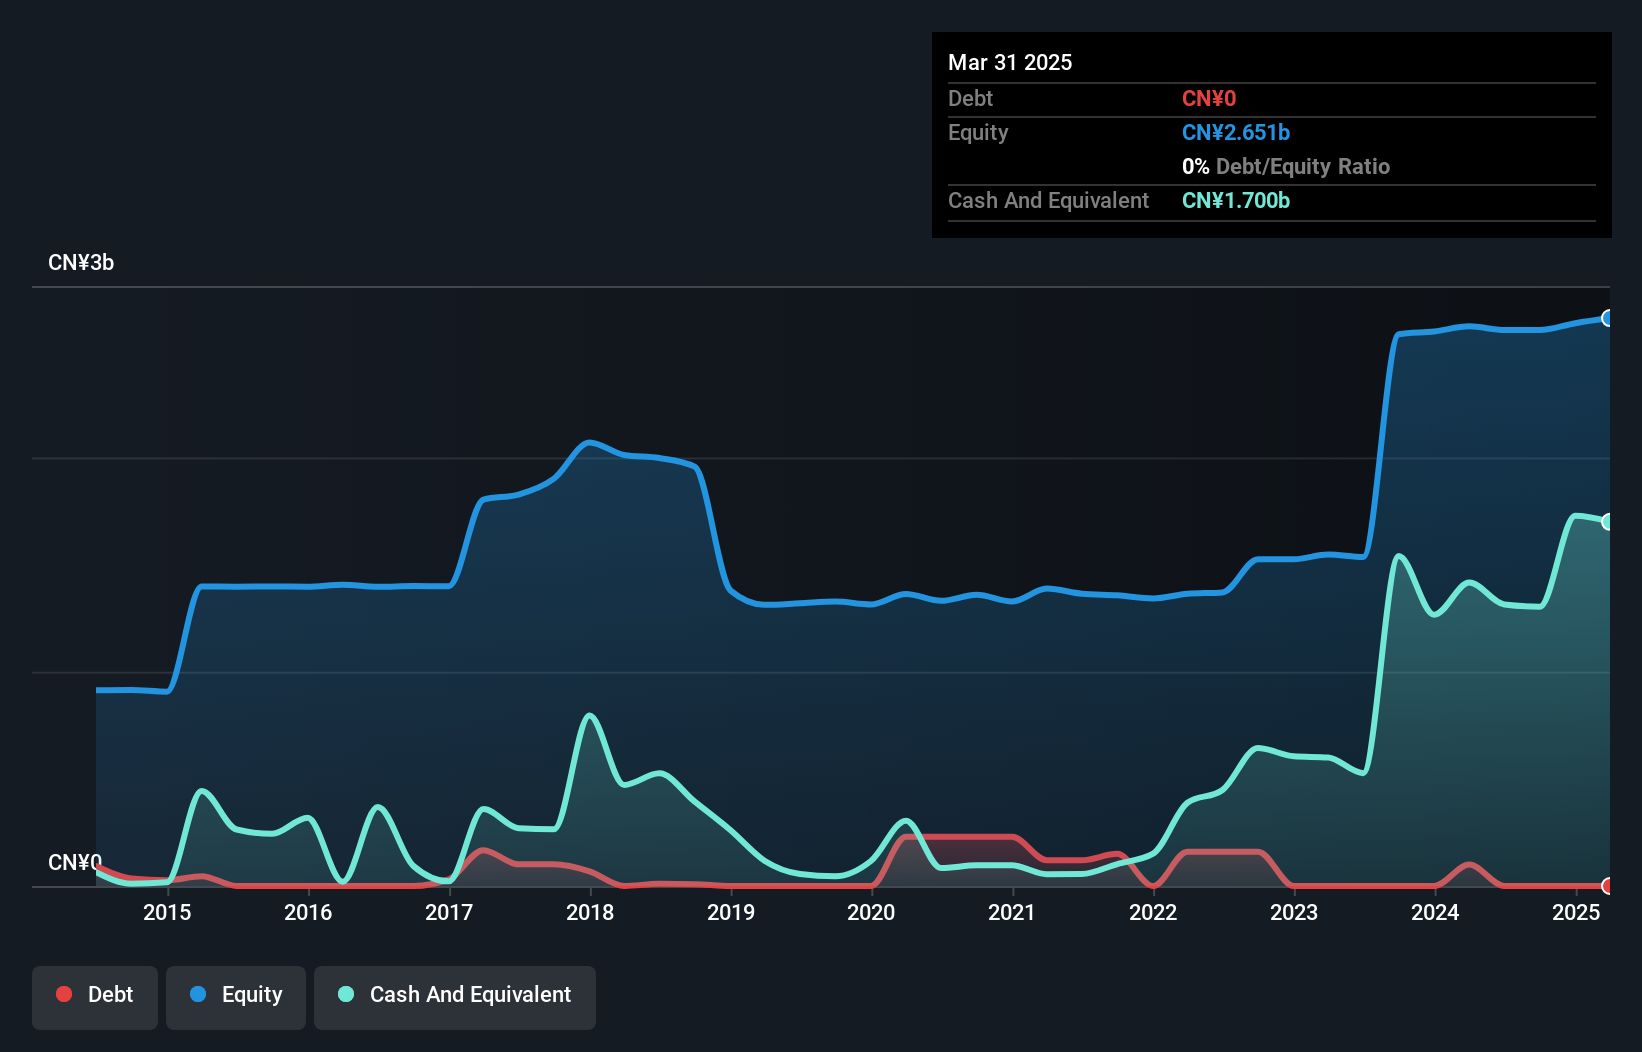
Jinzi Ham Ltd. showcases a unique profile with its debt-free status, having reduced its debt to equity ratio from 16.9% five years ago to zero today, which eliminates concerns about interest payments. Despite this strength, the company faces challenges as earnings have decreased by 0.8% annually over the past five years, and recent sales figures show a drop from CNY 258 million to CNY 222 million year-over-year for the nine months ending September 2025. The share price has been highly volatile recently, yet high-quality earnings remain a positive aspect of their financial health.
Feilong Auto Components (SZSE:002536)
Simply Wall St Value Rating: ★★★★★★
Overview: Feilong Auto Components Co., Ltd. processes, manufactures, and sells auto parts both in China and internationally, with a market cap of CN¥13.65 billion.
Operations: Feilong Auto Components derives its revenue primarily from automotive thermal management components, totaling CN¥4.45 billion.
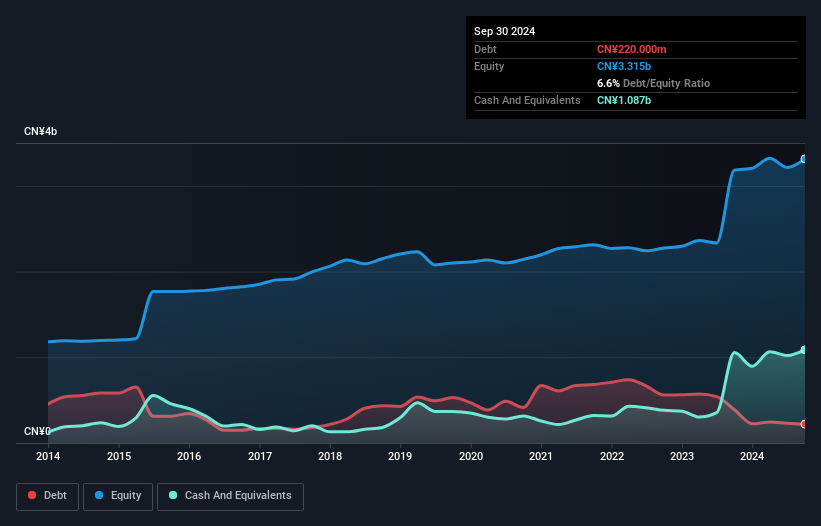
Feilong Auto Components, a smaller player in the auto components sector, has shown resilience with a net income of CNY 286.74 million for the first nine months of 2025, up from CNY 266.64 million last year. The company seems to be on solid ground with its debt-to-equity ratio improving from 19.4% to 12.8% over five years and earnings growth outpacing industry averages at 15.1%. Despite sales dipping from CNY 3,495.61 million to CNY 3,237.49 million year-on-year, Feilong's price-to-earnings ratio of 39x suggests it offers good value against the CN market average of 44.4x.
Turning Ideas Into Actions
- Click here to access our complete index of 2491 Asian Undiscovered Gems With Strong Fundamentals.
- Are you invested in these stocks already? Keep abreast of every twist and turn by setting up a portfolio with Simply Wall St, where we make it simple for investors like you to stay informed and proactive.
- Simply Wall St is a revolutionary app designed for long-term stock investors, it's free and covers every market in the world.
Ready To Venture Into Other Investment Styles?
- Explore high-performing small cap companies that haven't yet garnered significant analyst attention.
- Fuel your portfolio with companies showing strong growth potential, backed by optimistic outlooks both from analysts and management.
- Find companies with promising cash flow potential yet trading below their fair value.
This article by Simply Wall St is general in nature. We provide commentary based on historical data and analyst forecasts only using an unbiased methodology and our articles are not intended to be financial advice. It does not constitute a recommendation to buy or sell any stock, and does not take account of your objectives, or your financial situation. We aim to bring you long-term focused analysis driven by fundamental data. Note that our analysis may not factor in the latest price-sensitive company announcements or qualitative material. Simply Wall St has no position in any stocks mentioned.
Have feedback on this article? Concerned about the content? Get in touch with us directly. Alternatively, email editorial-team@simplywallst.com