
 Nasdaq
 華爾街日報
華爾街日報Kyocera (TSE:6971): Assessing Valuation After a Strong 7% Monthly and 43% Annual Share Price Rally
Kyocera (TSE:6971) has quietly put together an impressive run, with the share price climbing about 7% over the past month and roughly 43% over the past year, easily outpacing broader Japanese indices.
See our latest analysis for Kyocera.
The latest leg higher has been supported by solid underlying results, with steady revenue growth and a sharp improvement in net income helping to reframe Kyocera’s risk profile and fuel its strong year to date share price return.
If Kyocera’s momentum has caught your attention, it is also worth exploring other tech names that are gathering pace by scanning high growth tech and AI stocks.
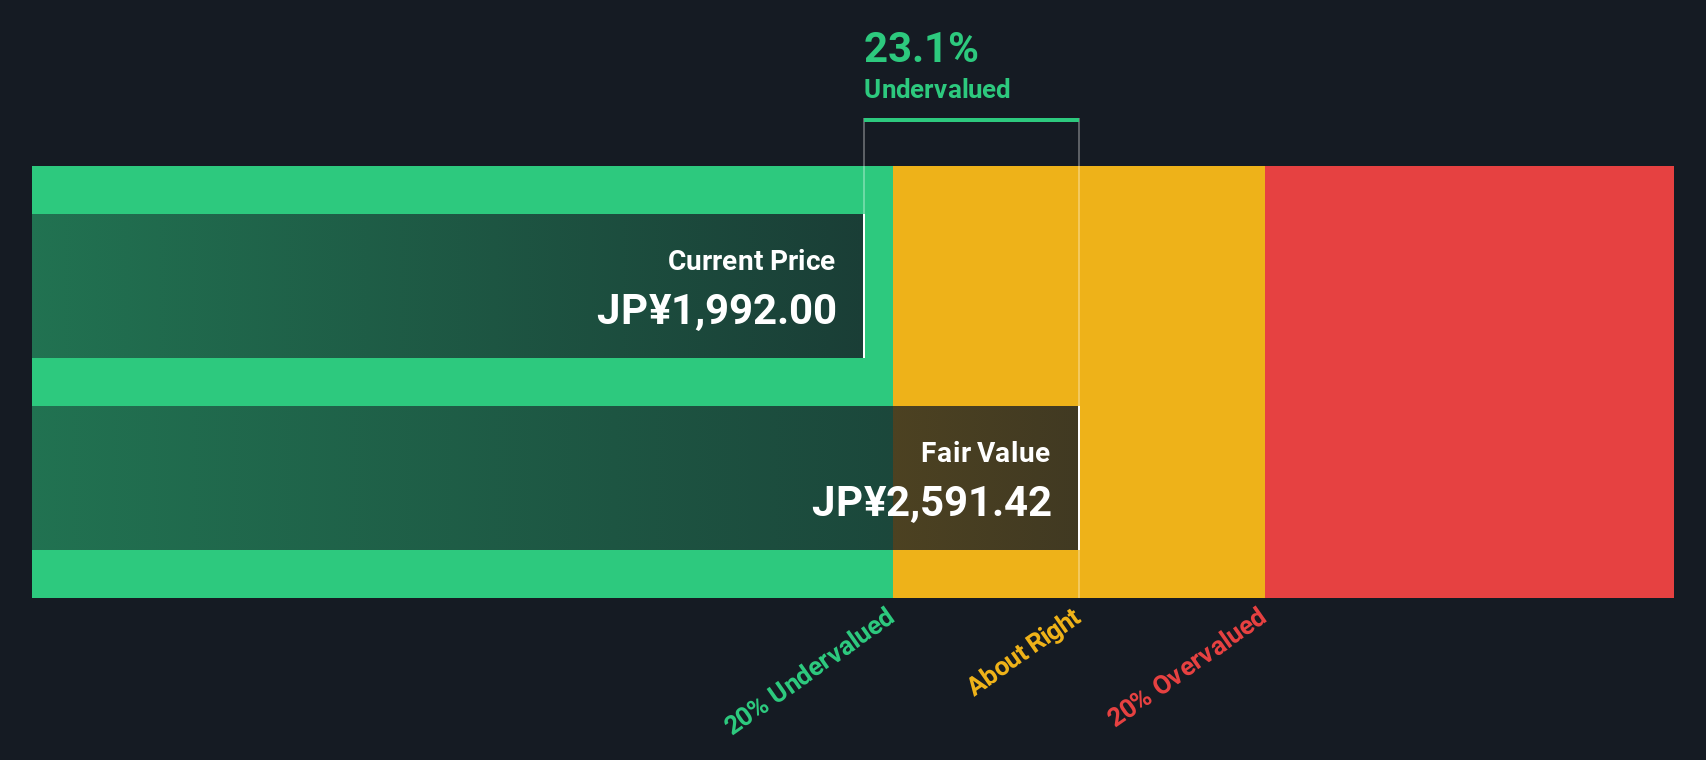
Yet with shares now trading close to analyst targets, but still at a modest discount to intrinsic value, the key question is whether Kyocera remains undervalued or if the market is already pricing in its future growth.
Price-to-Earnings of 68x: Is it justified?
Kyocera last closed at ¥2162, and on a price-to-earnings ratio of 68x the stock screens as expensive relative to both peers and its own fundamentals.
The price-to-earnings, or P E, ratio compares the company’s current share price with its per share earnings. It is a quick gauge of how much investors are paying for each unit of profit. For a diversified electronics group like Kyocera, this multiple is a common way for the market to express expectations about the durability and growth of future earnings.
In Kyocera’s case, a 68x P E suggests investors are pricing in a powerful earnings recovery, supported by forecasts for annual profit growth above the wider Japanese market and a return to cleaner results once one off losses roll off. However, this valuation stands in stark contrast to an estimated fair P E of 24.9x. This implies the market could eventually move toward a substantially lower multiple if expectations moderate.
That premium looks even starker when set against the roughly 15.1x average for the JP Electronic industry and an already elevated peer average of 32.9x. This places Kyocera at more than double the sector benchmark and well above similar companies.
Explore the SWS fair ratio for Kyocera
Result: Price-to-Earnings of 68x (OVERVALUED)
However, a pullback in tech demand or slower margin improvement than expected could quickly challenge the market’s optimism about Kyocera’s earnings recovery.
Find out about the key risks to this Kyocera narrative.
Another View: SWS DCF Suggests Upside
While the 68x price to earnings ratio looks stretched, our DCF model points in the opposite direction, suggesting Kyocera is around 10% undervalued versus an estimated fair value near ¥2,408 per share. If earnings return to a more typical level, is the market underestimating that rebound potential?
Look into how the SWS DCF model arrives at its fair value.
Simply Wall St performs a discounted cash flow (DCF) on every stock in the world every day (check out Kyocera for example). We show the entire calculation in full. You can track the result in your watchlist or portfolio and be alerted when this changes, or use our stock screener to discover 903 undervalued stocks based on their cash flows. If you save a screener we even alert you when new companies match - so you never miss a potential opportunity.
Build Your Own Kyocera Narrative
If you would rather challenge these assumptions and dig into the numbers yourself, you can easily build a personalised view in just a few minutes: Do it your way.
A great starting point for your Kyocera research is our analysis highlighting 2 key rewards and 3 important warning signs that could impact your investment decision.
Ready for your next investing move?
Kyocera may be compelling, but the real edge comes from lining up your next opportunities now, before everyone else rushes in.
- Capture potential multi baggers early by reviewing these 3595 penny stocks with strong financials that pair tiny market caps with financials that appear solid and momentum that appears to be accelerating.
- Position your portfolio at the heart of machine led disruption by scanning these 27 AI penny stocks shaping automation, data intelligence, and next generation software platforms.
- Seek higher income streams by targeting these 15 dividend stocks with yields > 3% that can strengthen your cash flow while others focus on story stocks without reliable payouts.
This article by Simply Wall St is general in nature. We provide commentary based on historical data and analyst forecasts only using an unbiased methodology and our articles are not intended to be financial advice. It does not constitute a recommendation to buy or sell any stock, and does not take account of your objectives, or your financial situation. We aim to bring you long-term focused analysis driven by fundamental data. Note that our analysis may not factor in the latest price-sensitive company announcements or qualitative material. Simply Wall St has no position in any stocks mentioned.
Have feedback on this article? Concerned about the content? Get in touch with us directly. Alternatively, email editorial-team@simplywallst.com