
 Nasdaq
 華爾街日報
華爾街日報Is Nestlé Becoming Attractive Again After Portfolio Reshaping And Weak Multi Year Share Performance?
- If you are wondering whether Nestlé is quietly becoming good value again, or if it is still priced for safety rather than upside, you are not alone. Plenty of long term investors are asking the same question.
- The stock is up 4.9% year to date and 7.3% over the last year, but those gains sit against a 21.5% slide over 3 years and a 9.5% drop over 5 years, suggesting the market is still recalibrating its expectations.
- Recent months have seen Nestlé in the headlines for portfolio reshaping and product innovation, from ongoing divestments of slower growth brands to renewed focus on premium coffee and pet care. At the same time, debates around pricing power and consumer demand in a higher cost environment have kept sentiment mixed. This helps explain the stop start share price performance.
- Right now, Nestlé scores a 4/6 valuation check score. This suggests it looks undervalued on several metrics but not across the board. In the sections that follow we will walk through the main valuation approaches the market uses today, before finishing with a more holistic way to think about what the stock is really worth.
Approach 1: Nestlé Discounted Cash Flow (DCF) Analysis
A Discounted Cash Flow model estimates what a business is worth today by projecting the cash it can generate in the future and discounting those cash flows back to the present.
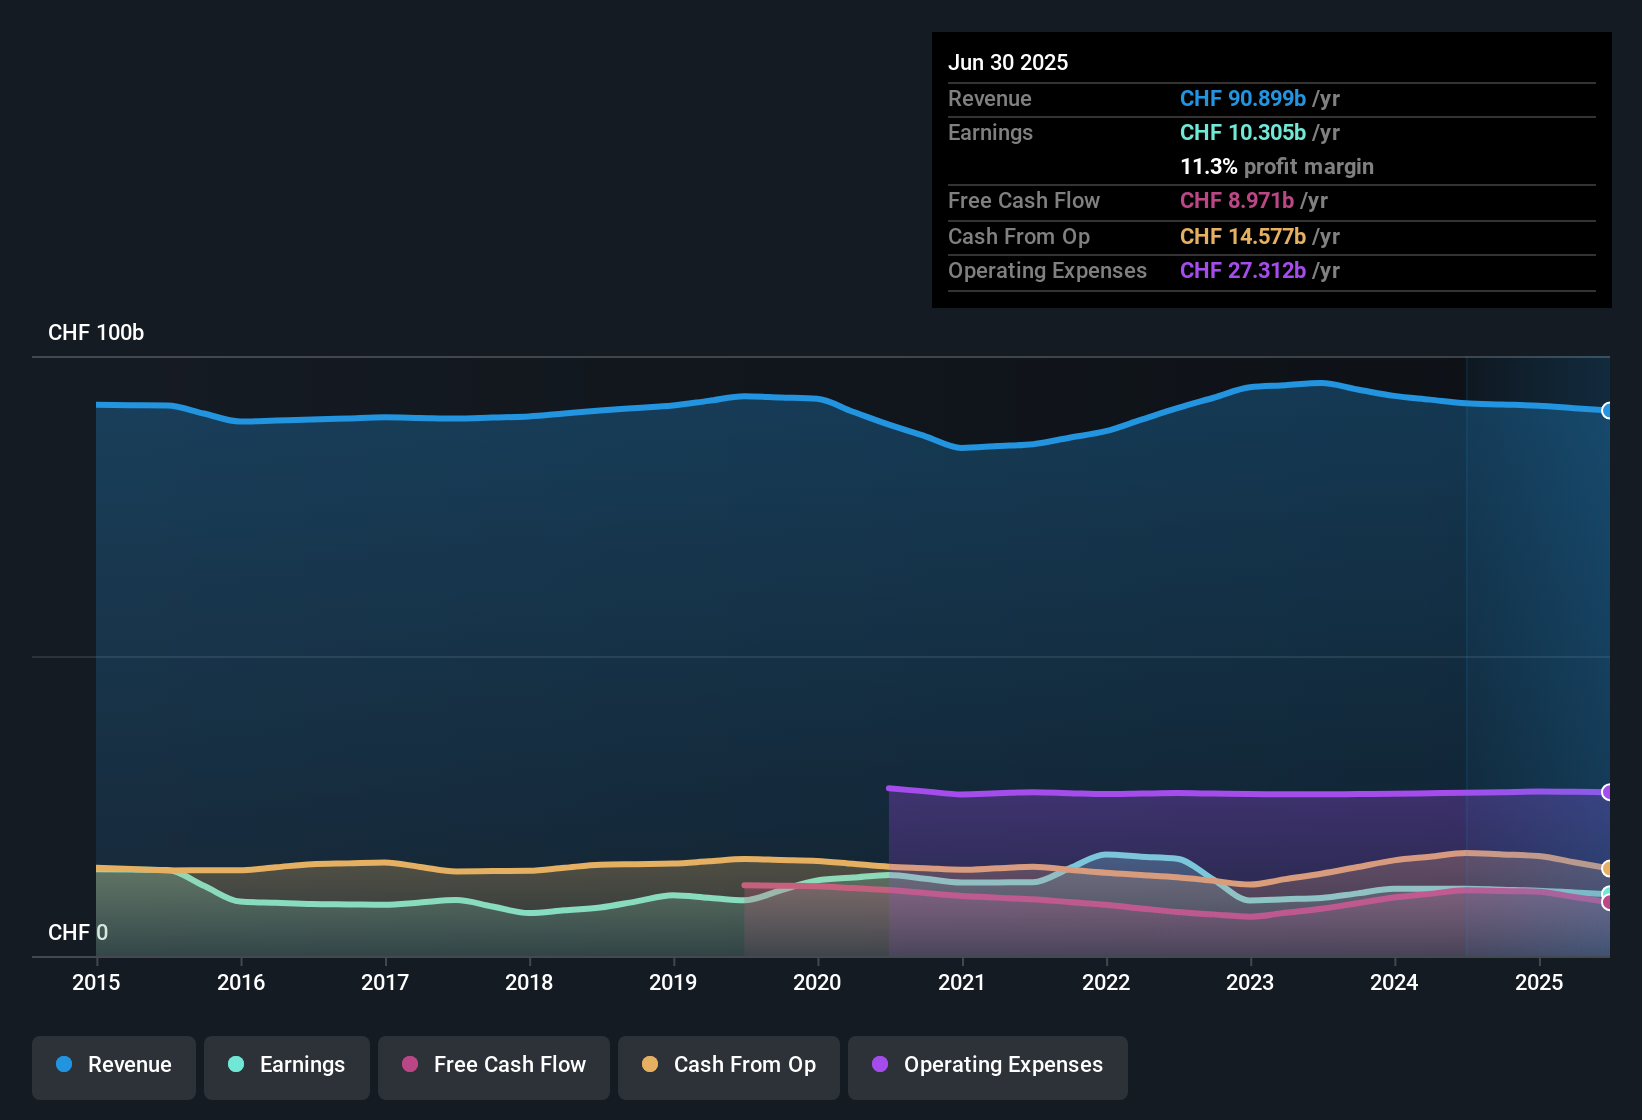
For Nestlé, the model starts from last twelve months free cash flow of roughly CHF 8.8 billion and uses analyst forecasts for the next few years. It then extrapolates further using Simply Wall St assumptions. Under this two stage Free Cash Flow to Equity framework, free cash flow is projected to grow steadily towards about CHF 13.2 billion by 2035 in nominal terms, with the rate of growth slowing over time.
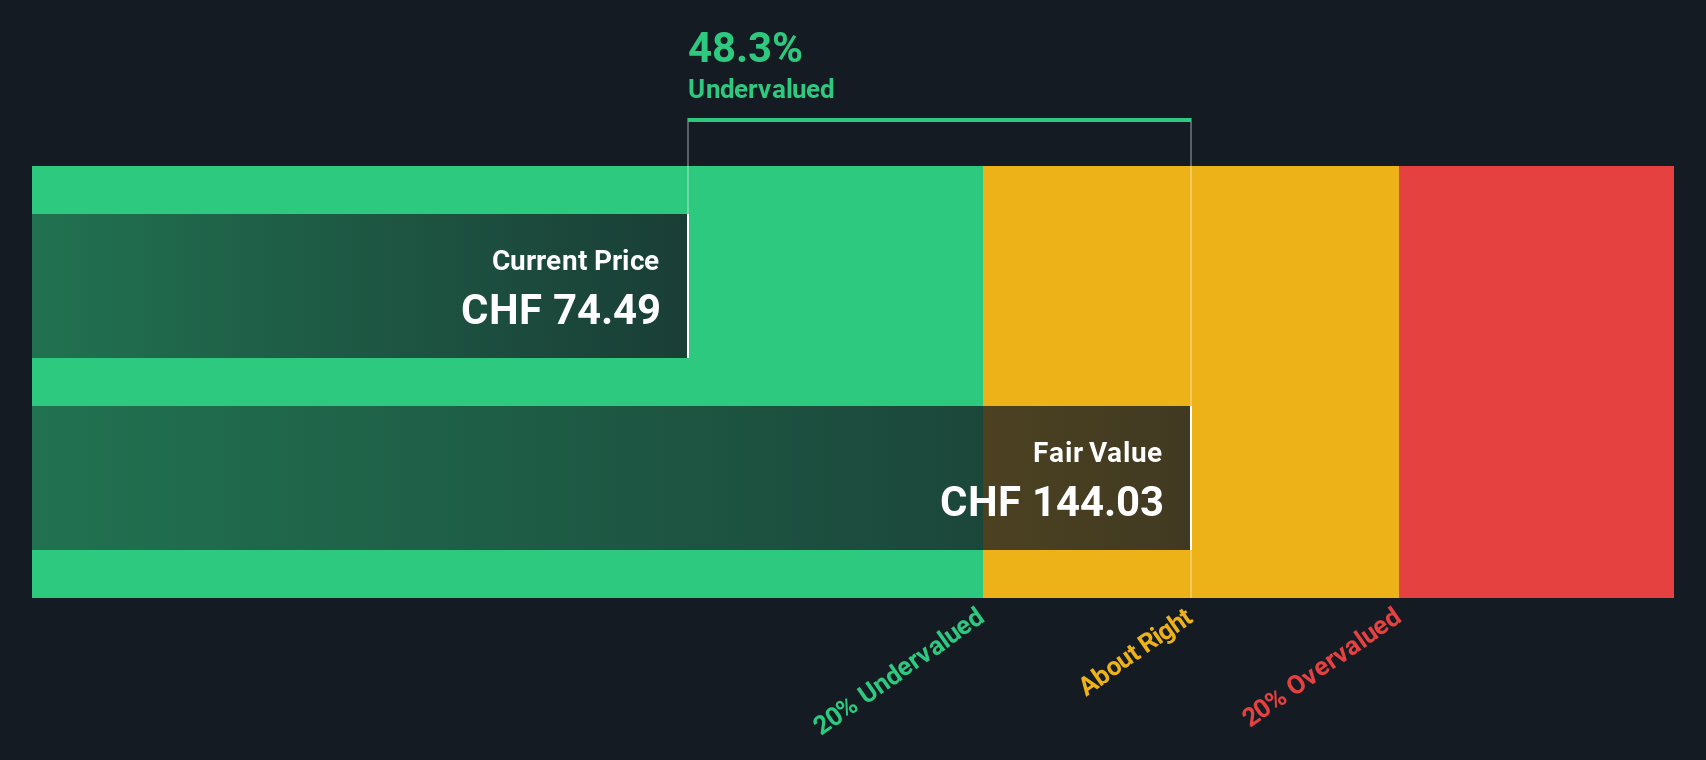
When these projected cash flows are discounted back, the intrinsic value comes out at around CHF 142.81 per share. That implies the stock is trading at roughly a 45.1% discount to its estimated fair value. This suggests the market is pricing Nestlé more cautiously than the cash flow outlook would imply.
Result: UNDERVALUED
Our Discounted Cash Flow (DCF) analysis suggests Nestlé is undervalued by 45.1%. Track this in your watchlist or portfolio, or discover 909 more undervalued stocks based on cash flows.
Approach 2: Nestlé Price vs Earnings
For profitable, mature businesses like Nestlé, the price to earnings, or PE, ratio is often the cleanest way to gauge how much investors are willing to pay for each unit of current earnings. It ties directly to what ultimately matters: cash generation supported by sustainable profits.
What counts as a normal or fair PE depends on how fast earnings are expected to grow and how risky those earnings are. Higher expected growth and lower perceived risk usually justify a higher multiple, while slower or more volatile growth tends to pull the PE down.
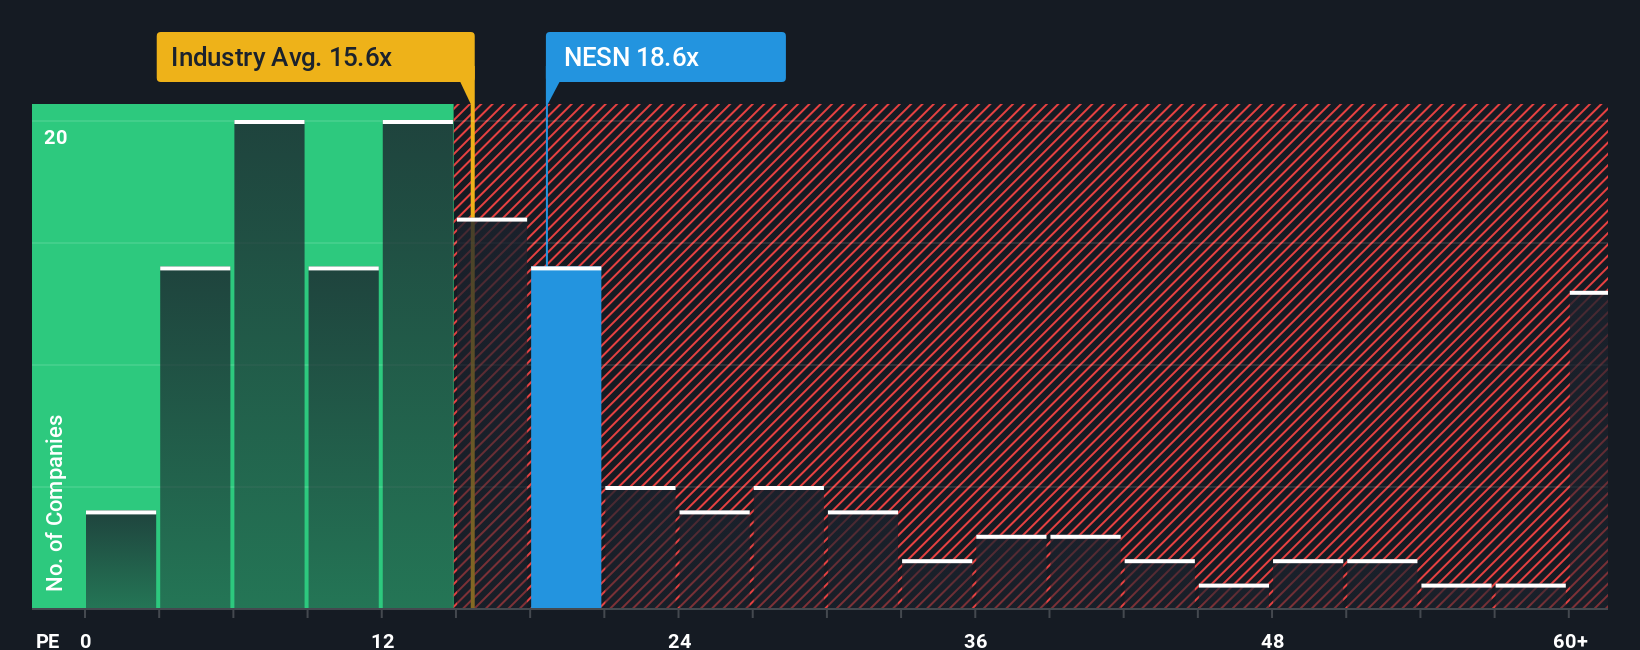
Nestlé currently trades on a PE of about 19.6x, above the broader Food industry average of roughly 15.9x, but below the peer group average of around 26.9x. Simply Wall St also calculates a proprietary Fair Ratio of 26.5x for Nestlé, which estimates the multiple the stock deserves given its earnings growth outlook, margins, industry, market cap and risk profile. This Fair Ratio is more informative than simple peer or sector comparisons because it adjusts for Nestlé specific quality and growth drivers rather than assuming all companies deserve similar pricing.
With a Fair Ratio of 26.5x versus the current 19.6x, Nestlé screens as undervalued on a PE basis.
Result: UNDERVALUED
PE ratios tell one story, but what if the real opportunity lies elsewhere? Discover 1451 companies where insiders are betting big on explosive growth.
Upgrade Your Decision Making: Choose your Nestlé Narrative
Earlier we mentioned that there is an even better way to understand valuation, so let us introduce you to Narratives, a simple way to connect your view of Nestlé’s story with a concrete forecast and fair value estimate. A Narrative is your own explanation of what is happening at the company and in its industry, combined with your assumptions about future revenue, earnings and margins, which then flow through to an estimated fair value. On Simply Wall St’s Community page, millions of investors use Narratives as an easy, accessible tool to decide whether Nestlé looks like a buy or a sell, by comparing their Fair Value to today’s share price and seeing how much upside or downside they believe is likely. These Narratives update dynamically as new information arrives, like earnings results, CEO changes or major strategic announcements, so your story and numbers stay in sync. For example, one optimistic Nestlé Narrative might assume successful execution on efficiency programs and premium nutrition growth to justify a fair value near CHF 103 per share, while a more cautious Narrative could focus on margin pressure and slower demand to support a fair value closer to CHF 71, showing how different perspectives can coexist around the same stock.
Do you think there's more to the story for Nestlé? Head over to our Community to see what others are saying!
This article by Simply Wall St is general in nature. We provide commentary based on historical data and analyst forecasts only using an unbiased methodology and our articles are not intended to be financial advice. It does not constitute a recommendation to buy or sell any stock, and does not take account of your objectives, or your financial situation. We aim to bring you long-term focused analysis driven by fundamental data. Note that our analysis may not factor in the latest price-sensitive company announcements or qualitative material. Simply Wall St has no position in any stocks mentioned.
Have feedback on this article? Concerned about the content? Get in touch with us directly. Alternatively, email editorial-team@simplywallst.com