
 Nasdaq
 華爾街日報
華爾街日報Is KeyCorp Still Attractive After 2025 Rally and Mixed Valuation Signals?
- Wondering if KeyCorp at around $19 is still a smart buy or if the easy gains are already gone? You are not alone. This breakdown aims to cut through the noise and focus on what the numbers really say about value.
- Over the last week KeyCorp is up 4.1%, 7.2% over the past month, and 14.2% year to date. These moves hint investors are warming back up to regional banks after a rocky stretch.
- Recent headlines have focused on KeyCorp's strategic positioning among regional banks, regulatory developments affecting the sector, and shifting expectations for interest rates, all of which shape how investors think about its future profitability and risk. Together, these themes help explain why the stock has been grinding higher instead of trading sideways.
- Right now, KeyCorp scores just 2/6 on our valuation checks, suggesting the market may already be pricing in a lot of good news, but not necessarily all of it. In the sections ahead we will unpack this using several valuation approaches, and then wrap up with an even better way to think about what KeyCorp is really worth.
KeyCorp scores just 2/6 on our valuation checks. See what other red flags we found in the full valuation breakdown.
Approach 1: KeyCorp Excess Returns Analysis
The Excess Returns model looks at how much profit KeyCorp can earn above the return that shareholders demand on their equity, and then converts those surplus profits into an intrinsic value per share.
For KeyCorp, the starting point is a Book Value of $15.82 per share and a Stable EPS of $1.81 per share, based on weighted future Return on Equity estimates from 14 analysts. The average Return on Equity is 10.57%, while the Cost of Equity is $1.24 per share, leaving an Excess Return of $0.58 per share. Analysts also expect Stable Book Value to grow to $17.16 per share, supported by estimates from 13 analysts.
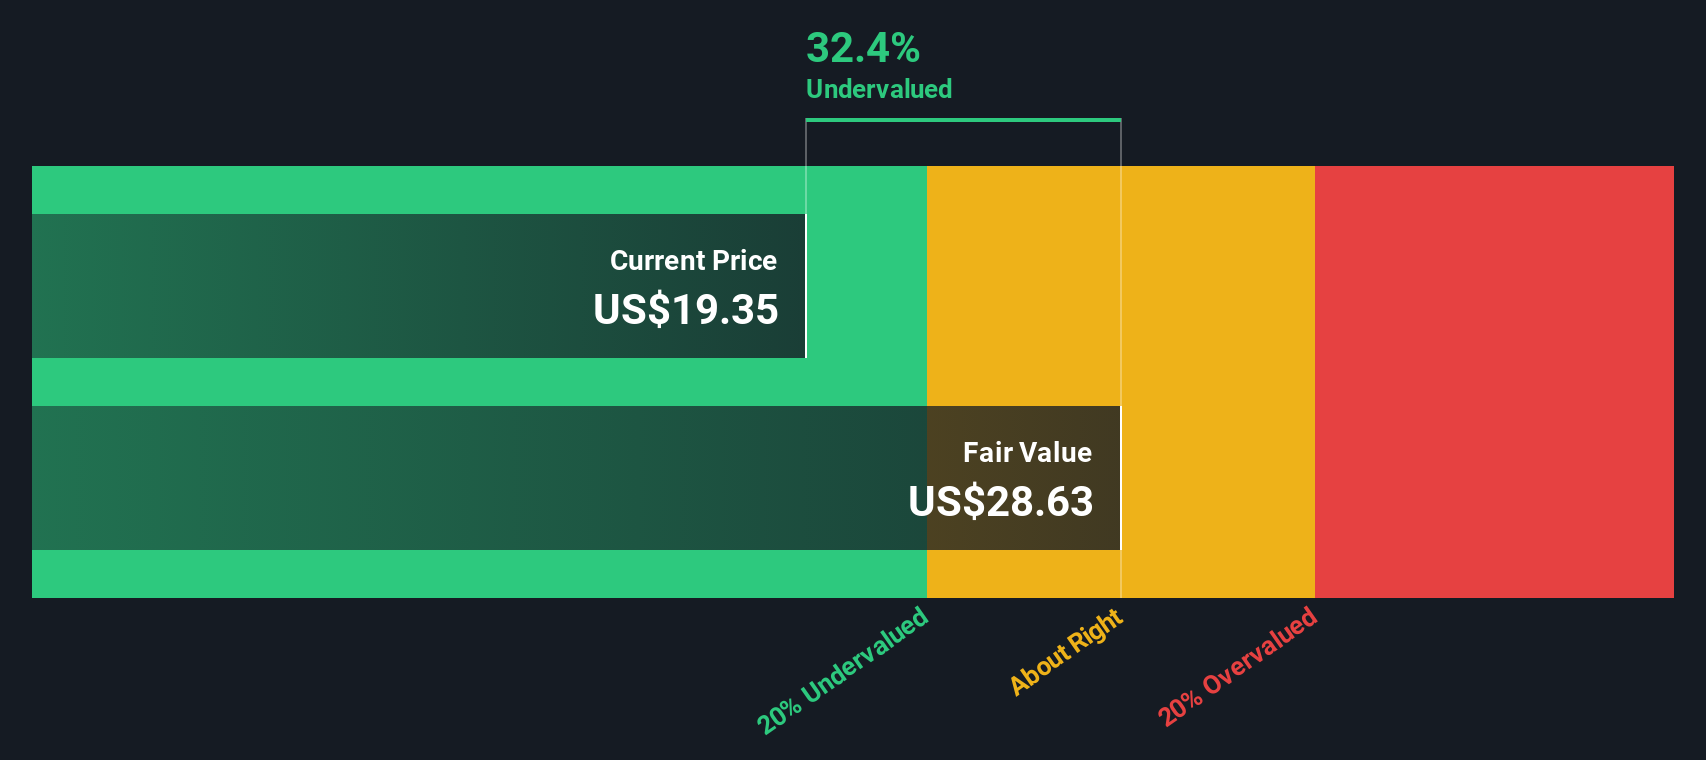
Putting these inputs into the Excess Returns framework yields an intrinsic value of about $31.73 per share. Compared with the current share price around $19, the model implies the stock is roughly 38.9% undervalued. This output indicates that, within this model, the market price may not fully reflect KeyCorp's estimated ability to generate returns above its cost of equity.
Result: UNDERVALUED
Our Excess Returns analysis suggests KeyCorp is undervalued by 38.9%. Track this in your watchlist or portfolio, or discover 909 more undervalued stocks based on cash flows.
Approach 2: KeyCorp Price vs Earnings
The price to earnings, or PE, ratio is a useful way to value profitable companies because it links what investors pay for each share directly to the earnings that support that share price. In broad terms, faster, more reliable earnings growth and lower perceived risk usually justify a higher, or more expensive, PE multiple, while slower growth and higher risk tend to pull a fair PE lower.
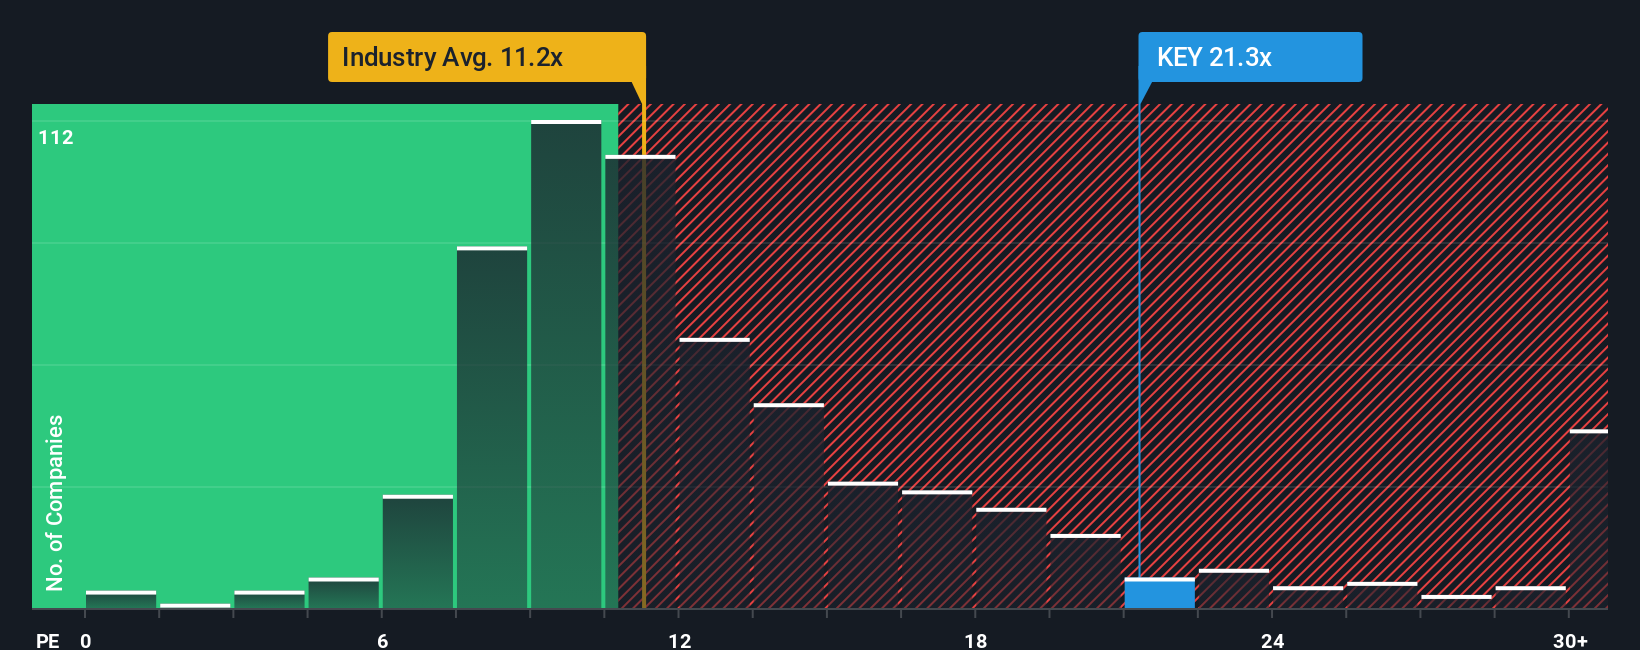
KeyCorp currently trades on a PE of about 22.7x, which is notably richer than both the wider Banks industry average of roughly 11.7x and the peer group average around 12.7x. On the surface, that makes the stock look expensive relative to other banks. However, Simply Wall St’s Fair Ratio framework goes a step further by estimating what a justified PE should be after accounting for KeyCorp’s specific growth profile, profitability, risk factors, industry positioning and market cap. For KeyCorp, this Fair Ratio sits at about 19.1x, meaning the shares trade a few turns above what our fundamentals based model would consider fair.
Result: OVERVALUED
PE ratios tell one story, but what if the real opportunity lies elsewhere? Discover 1452 companies where insiders are betting big on explosive growth.
Upgrade Your Decision Making: Choose your KeyCorp Narrative
Earlier we mentioned that there is an even better way to understand valuation, so let us introduce you to Narratives, a simple way to connect your view of a company’s story to a set of numbers like future revenue, earnings, margins, and ultimately a fair value estimate. A Narrative on Simply Wall St’s Community page is your own structured story about KeyCorp that links what you believe about its competitive position, risks, and growth drivers to a financial forecast, and then to the fair value you think is reasonable. Once you have created or adopted a Narrative, the platform continuously compares its Fair Value to the live share price to help you decide whether KeyCorp looks like a buy, hold, or sell, and automatically updates that view when new earnings, news, or guidance come through. For example, one investor might build a bullish KeyCorp Narrative that leans toward a price closer to $43, while a more cautious investor might anchor theirs near $16, and seeing these different fair values side by side helps you judge where your own convictions and assumptions sit on that spectrum.
Do you think there's more to the story for KeyCorp? Head over to our Community to see what others are saying!
This article by Simply Wall St is general in nature. We provide commentary based on historical data and analyst forecasts only using an unbiased methodology and our articles are not intended to be financial advice. It does not constitute a recommendation to buy or sell any stock, and does not take account of your objectives, or your financial situation. We aim to bring you long-term focused analysis driven by fundamental data. Note that our analysis may not factor in the latest price-sensitive company announcements or qualitative material. Simply Wall St has no position in any stocks mentioned.
Have feedback on this article? Concerned about the content? Get in touch with us directly. Alternatively, email editorial-team@simplywallst.com