
 Nasdaq
 華爾街日報
華爾街日報Is Sandvik’s Strong 2025 Share Price Run Still Supported by Fundamentals?
- Wondering if Sandvik is still a smart buy after its big run, or if most of the upside is already baked in? Let us unpack what the current price really implies about its future.
- Sandvik shares have climbed 45.6% year to date and 39.7% over the last year, adding to a strong 67.2% three year and 75.8% five year track record. This comes even as the most recent 7 day and 30 day gains of 2.3% and 2.5% hint at a slower, more measured climb from the last close of SEK 293.
- Recent moves have been shaped by ongoing investor focus on industrial automation, mining and infrastructure spending, areas where Sandvik is seen as a key beneficiary. In addition, strategic portfolio tweaks and a steady drumbeat of contracts and partnerships have reinforced the narrative that this is not just a cyclical machinery play, but a structural growth story.
- Despite that strength, Sandvik only scores 2/6 on our valuation checks, suggesting the market might already be paying up for much of that optimism, or missing value in specific areas. Next we will walk through multiple valuation approaches to see where the numbers land, before finishing with a more holistic way to judge whether the current price truly reflects Sandvik's long term potential.
Sandvik scores just 2/6 on our valuation checks. See what other red flags we found in the full valuation breakdown.
Approach 1: Sandvik Discounted Cash Flow (DCF) Analysis
A Discounted Cash Flow model projects the cash a business is expected to generate in the future and then discounts those cash flows back to today to estimate what the company is worth now. For Sandvik, the 2 stage Free Cash Flow to Equity model starts from last twelve months free cash flow of about SEK 14.9 billion and uses analyst forecasts for the next few years, with later years extrapolated by Simply Wall St.
On this basis, Sandvik is projected to generate free cash flow of around SEK 17.3 billion by 2029, with additional gradual growth assumed out to 2035. When all these future cash flows are discounted back, the model produces an intrinsic value of roughly SEK 246.54 per share.
Compared with the recent market price near SEK 293, the DCF suggests Sandvik is about 18.8% overvalued, which indicates that investors are already paying a premium for its future cash flows.
Result: OVERVALUED
Our Discounted Cash Flow (DCF) analysis suggests Sandvik may be overvalued by 18.8%. Discover 903 undervalued stocks or create your own screener to find better value opportunities.

Approach 2: Sandvik Price vs Earnings
For profitable companies like Sandvik, the price to earnings, or P E, ratio is a useful way to gauge how much investors are willing to pay for each unit of current earnings. In general, companies with stronger growth prospects and lower perceived risk can justify trading on a higher, or more expensive, P E multiple, while slower growing or riskier businesses should command a lower one.
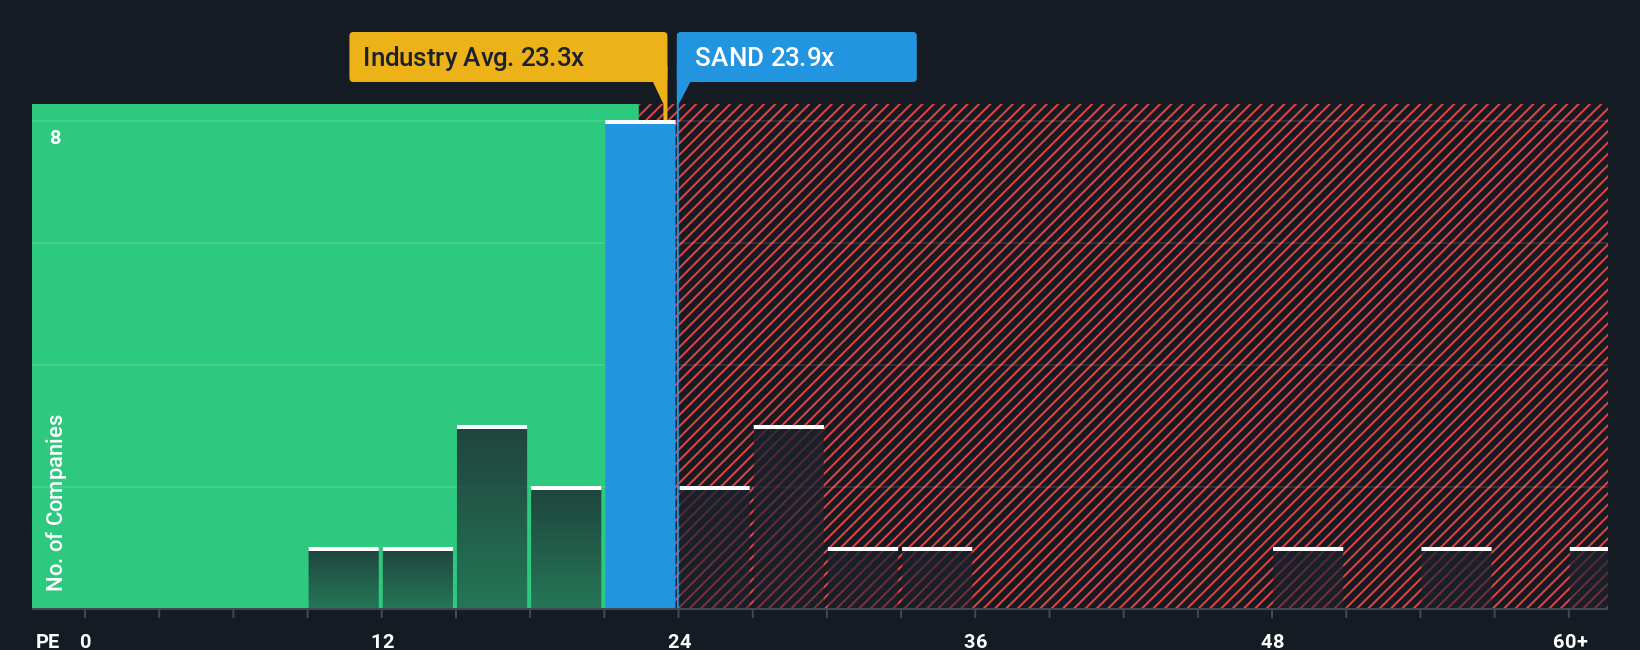
Sandvik currently trades on a P E ratio of about 24.9x. That is slightly above the broader Machinery industry average of around 23.7x and just below the peer group average of roughly 25.1x, suggesting the market is valuing Sandvik at a modest premium to the sector, but in line with close comparables. To refine this view, Simply Wall St calculates a proprietary Fair Ratio of 27.5x, which reflects what Sandvik’s P E should be once you factor in its specific earnings growth outlook, profitability, risk profile, industry positioning and market cap.
This Fair Ratio is more tailored than simple peer or industry comparisons because it adjusts for Sandvik’s own fundamentals rather than assuming every machinery stock deserves the same multiple. With the shares trading at 24.9x versus a Fair Ratio of 27.5x, the preferred multiple suggests Sandvik is modestly undervalued.
Result: UNDERVALUED
PE ratios tell one story, but what if the real opportunity lies elsewhere? Discover 1453 companies where insiders are betting big on explosive growth.
Upgrade Your Decision Making: Choose your Sandvik Narrative
Earlier we mentioned that there is an even better way to understand valuation, so let us introduce you to Narratives, a simple way to connect the story you believe about Sandvik with the numbers you plug in for its future revenue, earnings, margins and ultimately fair value.
A Narrative is your own investment storyline for a company, where you spell out why you think the business will win or struggle, translate that view into a financial forecast, and then see what fair value that implies, rather than just accepting a single static target price.
On Simply Wall St, Narratives live in the Community page and are used by millions of investors as an easy, accessible tool to decide when to buy or sell, by constantly comparing each Narrative’s Fair Value to Sandvik’s live market price.
Because Narratives update dynamically when new data arrives, such as earnings or major contract news, your fair value view can shift in real time. This means a bullish investor who thinks Sandvik deserves something closer to SEK 335 and a more cautious one who sees nearer SEK 161 can both track how fresh information moves their story and signals whether today’s price still looks attractive or stretched.
Do you think there's more to the story for Sandvik? Head over to our Community to see what others are saying!

This article by Simply Wall St is general in nature. We provide commentary based on historical data and analyst forecasts only using an unbiased methodology and our articles are not intended to be financial advice. It does not constitute a recommendation to buy or sell any stock, and does not take account of your objectives, or your financial situation. We aim to bring you long-term focused analysis driven by fundamental data. Note that our analysis may not factor in the latest price-sensitive company announcements or qualitative material. Simply Wall St has no position in any stocks mentioned.
Have feedback on this article? Concerned about the content? Get in touch with us directly. Alternatively, email editorial-team@simplywallst.com