
 Nasdaq
 華爾街日報
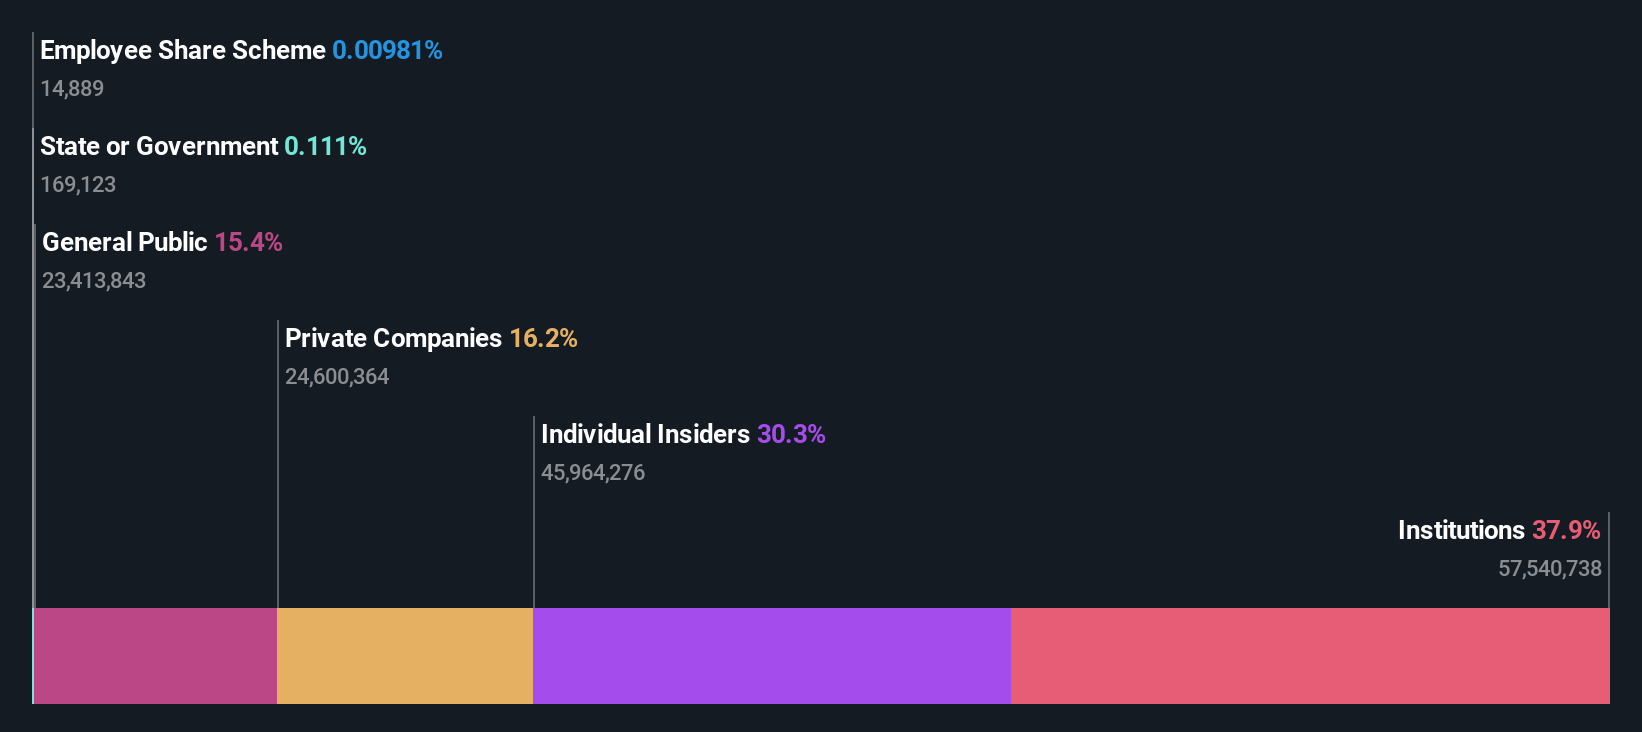
華爾街日報With 38% institutional ownership, PI Industries Limited (NSE:PIIND) is a favorite amongst the big guns
Key Insights
- Institutions' substantial holdings in PI Industries implies that they have significant influence over the company's share price
- The top 7 shareholders own 53% of the company
- Insiders own 30% of PI Industries
To get a sense of who is truly in control of PI Industries Limited (NSE:PIIND), it is important to understand the ownership structure of the business. And the group that holds the biggest piece of the pie are institutions with 38% ownership. That is, the group stands to benefit the most if the stock rises (or lose the most if there is a downturn).
Since institutional have access to huge amounts of capital, their market moves tend to receive a lot of scrutiny by retail or individual investors. Therefore, a good portion of institutional money invested in the company is usually a huge vote of confidence on its future.
Let's take a closer look to see what the different types of shareholders can tell us about PI Industries.
View our latest analysis for PI Industries
What Does The Institutional Ownership Tell Us About PI Industries?
Institutions typically measure themselves against a benchmark when reporting to their own investors, so they often become more enthusiastic about a stock once it's included in a major index. We would expect most companies to have some institutions on the register, especially if they are growing.
PI Industries already has institutions on the share registry. Indeed, they own a respectable stake in the company. This implies the analysts working for those institutions have looked at the stock and they like it. But just like anyone else, they could be wrong. It is not uncommon to see a big share price drop if two large institutional investors try to sell out of a stock at the same time. So it is worth checking the past earnings trajectory of PI Industries, (below). Of course, keep in mind that there are other factors to consider, too.

We note that hedge funds don't have a meaningful investment in PI Industries. The company's CEO Mayank Singhal is the largest shareholder with 20% of shares outstanding. Salil Singhal is the second largest shareholder owning 9.4% of common stock, and Life Insurance Corporation of India holds about 6.3% of the company stock.
We also observed that the top 7 shareholders account for more than half of the share register, with a few smaller shareholders to balance the interests of the larger ones to a certain extent.
Researching institutional ownership is a good way to gauge and filter a stock's expected performance. The same can be achieved by studying analyst sentiments. There are plenty of analysts covering the stock, so it might be worth seeing what they are forecasting, too.
Insider Ownership Of PI Industries
The definition of company insiders can be subjective and does vary between jurisdictions. Our data reflects individual insiders, capturing board members at the very least. Company management run the business, but the CEO will answer to the board, even if he or she is a member of it.
I generally consider insider ownership to be a good thing. However, on some occasions it makes it more difficult for other shareholders to hold the board accountable for decisions.
Our information suggests that insiders maintain a significant holding in PI Industries Limited. It has a market capitalization of just ₹505b, and insiders have ₹153b worth of shares in their own names. That's quite significant. Most would be pleased to see the board is investing alongside them. You may wish to access this free chart showing recent trading by insiders.
General Public Ownership
The general public, who are usually individual investors, hold a 15% stake in PI Industries. While this group can't necessarily call the shots, it can certainly have a real influence on how the company is run.
Private Company Ownership
Our data indicates that Private Companies hold 16%, of the company's shares. It's hard to draw any conclusions from this fact alone, so its worth looking into who owns those private companies. Sometimes insiders or other related parties have an interest in shares in a public company through a separate private company.
Next Steps:
It's always worth thinking about the different groups who own shares in a company. But to understand PI Industries better, we need to consider many other factors. Be aware that PI Industries is showing 2 warning signs in our investment analysis , and 1 of those doesn't sit too well with us...
Ultimately the future is most important. You can access this free report on analyst forecasts for the company.
NB: Figures in this article are calculated using data from the last twelve months, which refer to the 12-month period ending on the last date of the month the financial statement is dated. This may not be consistent with full year annual report figures.
Have feedback on this article? Concerned about the content? Get in touch with us directly. Alternatively, email editorial-team (at) simplywallst.com.
This article by Simply Wall St is general in nature. We provide commentary based on historical data and analyst forecasts only using an unbiased methodology and our articles are not intended to be financial advice. It does not constitute a recommendation to buy or sell any stock, and does not take account of your objectives, or your financial situation. We aim to bring you long-term focused analysis driven by fundamental data. Note that our analysis may not factor in the latest price-sensitive company announcements or qualitative material. Simply Wall St has no position in any stocks mentioned.