
 Nasdaq
 華爾街日報
華爾街日報What Chewy’s Choppy Share Performance Means for Its 2025 Valuation Outlook
- If you are wondering whether Chewy is finally attractive at today’s price or still just a story stock that has run ahead of its fundamentals, this breakdown will help you frame the risk and reward in plain English.
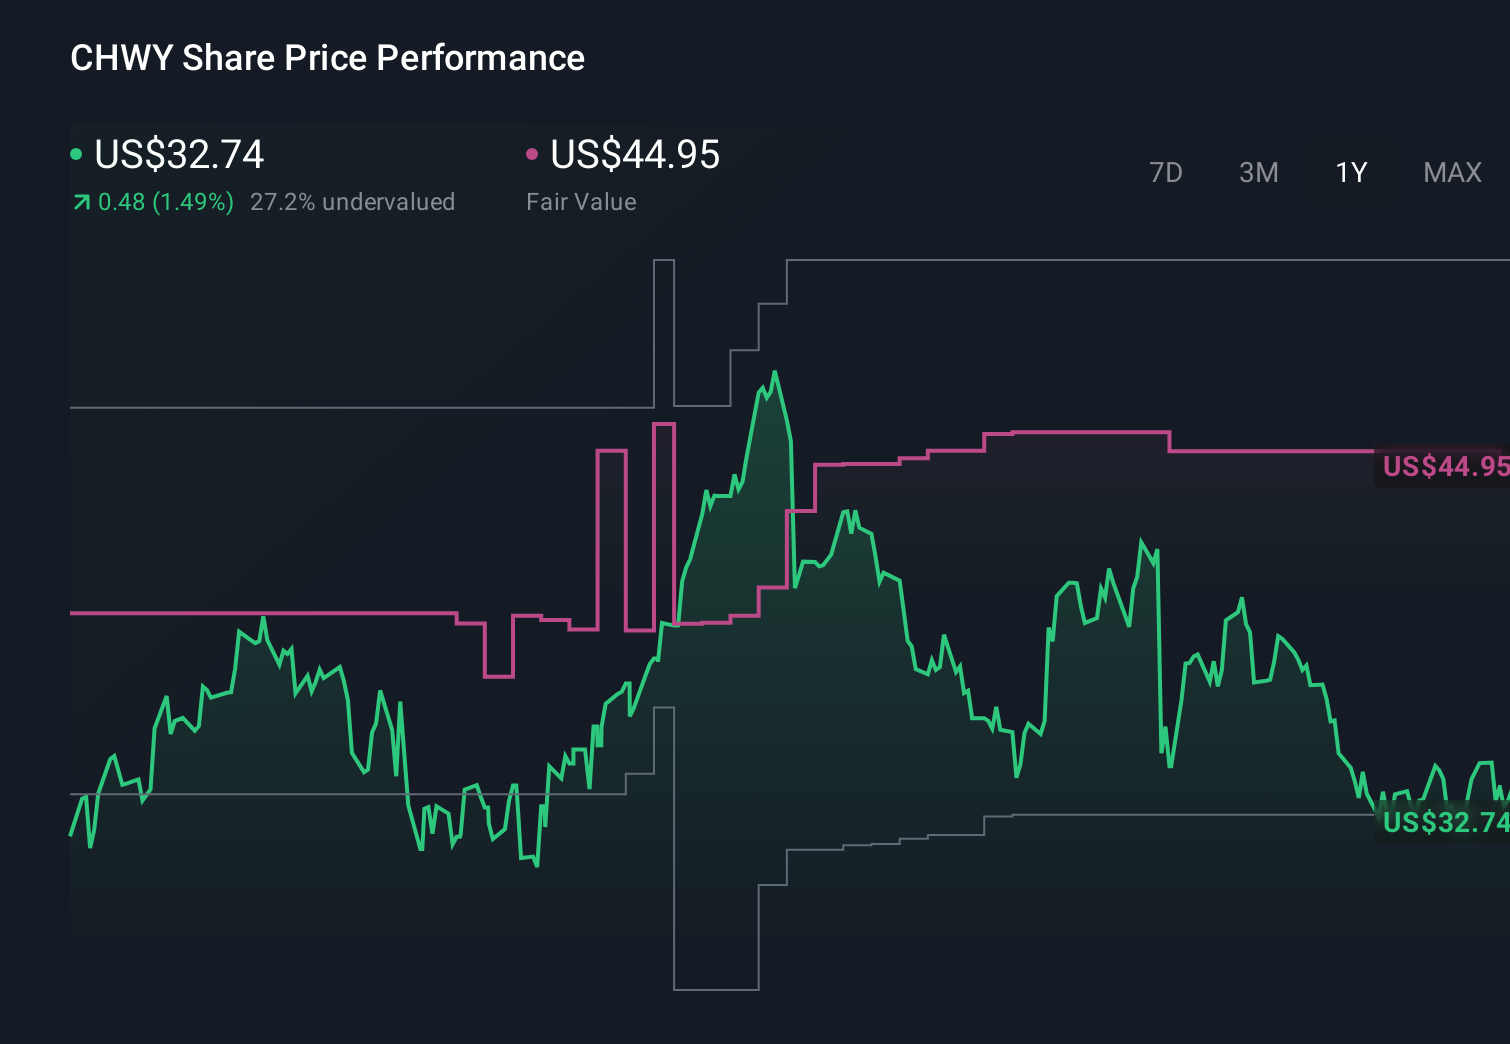
- Chewy’s share price has been choppy, slipping about 0.5% over the last week but still up 2.7% over the past month and 12.1% over the last year, even after a tough 3-year and 5-year stretch with returns of around -23.3% and -58.2% respectively.
- Recent moves have come as investors continue to debate the durability of Chewy’s online pet retail model and its ability to convert its loyal customer base into consistently higher margins and cash flows. At the same time, broader shifts toward e‑commerce, subscription-style auto-ship programs, and pet health services keep Chewy in the conversation whenever the market looks for long-term growth themes.
- Right now, Chewy scores a 3/6 valuation check score, meaning it screens as undervalued on half of our standard tests. Below, we will explore what that implies using different valuation approaches, then finish with an intuitive way to think about what the stock might be worth.
Approach 1: Chewy Discounted Cash Flow (DCF) Analysis
A Discounted Cash Flow model projects a company’s future cash flows and then discounts them back into today’s dollars, giving an estimate of what the entire business might be worth right now.
For Chewy, the latest twelve month Free Cash Flow is about $447 million. Analysts and internal estimates see that figure rising steadily, with projected Free Cash Flow of roughly $1.23 billion by 2030 as the business scales and margins improve. Simply Wall St uses a 2 Stage Free Cash Flow to Equity approach, combining analyst forecasts for the next few years with extrapolated growth beyond that to build a 10 year cash flow picture.
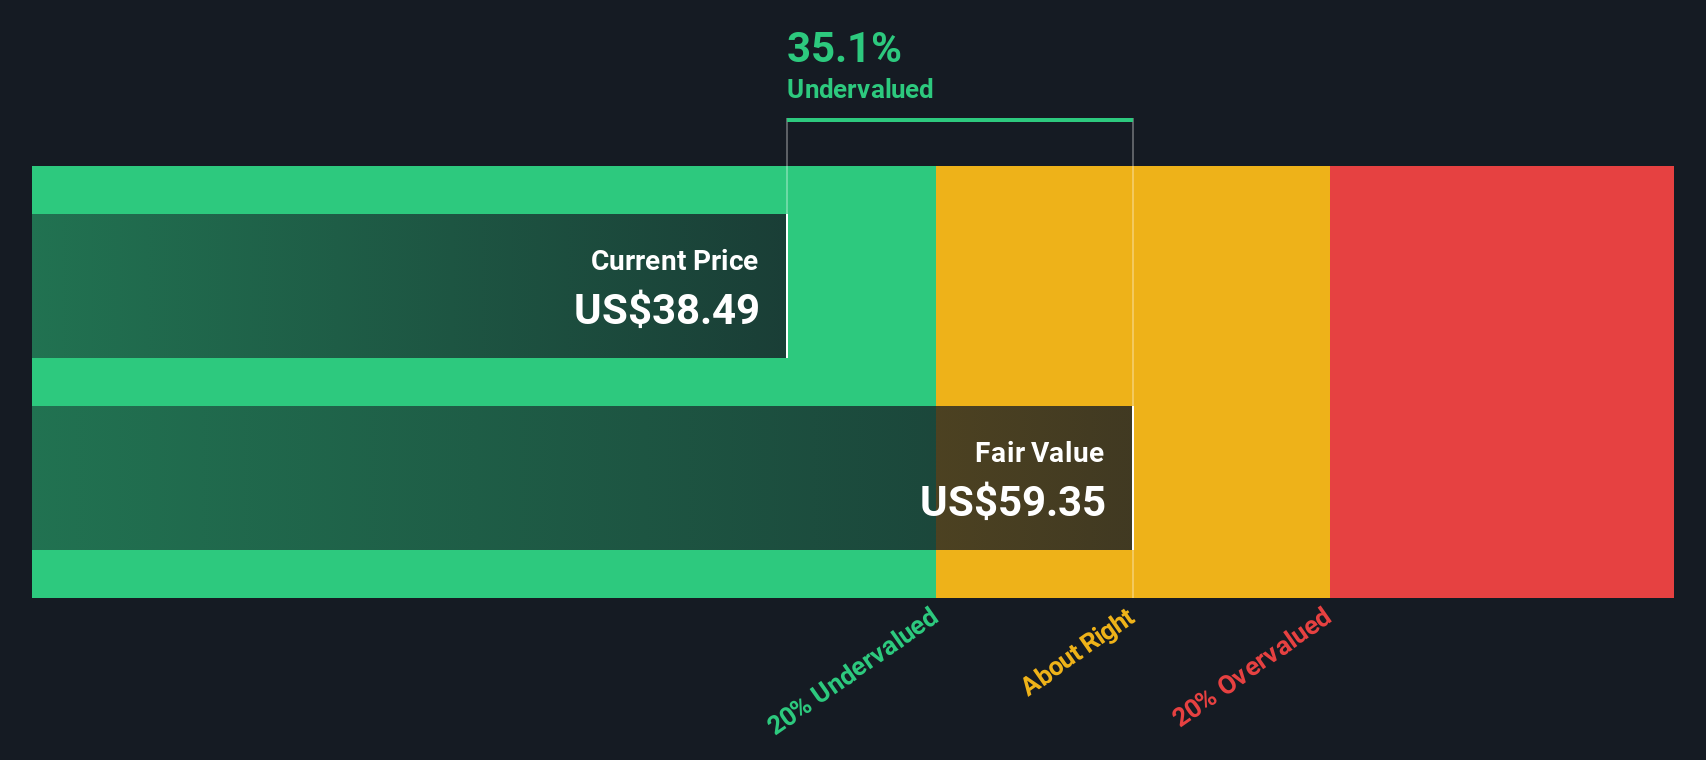
When those future cash flows are discounted back to today, the model arrives at an intrinsic value of about $57.49 per share. That implies Chewy is trading at roughly a 39.8% discount to its estimated fair value, and suggests the market is still skeptical about how durable that growth and cash generation will be.
Result: UNDERVALUED
Our Discounted Cash Flow (DCF) analysis suggests Chewy is undervalued by 39.8%. Track this in your watchlist or portfolio, or discover 902 more undervalued stocks based on cash flows.
Approach 2: Chewy Price vs Earnings
For profitable businesses, the price to earnings ratio is a useful way to gauge how much investors are willing to pay today for each dollar of current earnings. A higher PE can be justified when the market expects stronger growth or sees the company as relatively low risk, while slower growth or higher uncertainty usually warrants a lower, more conservative PE.
Chewy currently trades on about 95.0x earnings, well above the Specialty Retail industry average of roughly 20.0x and also ahead of its peer group average of around 24.5x. To move beyond simple comparisons, Simply Wall St estimates a Fair Ratio of about 28.4x for Chewy. This proprietary metric reflects what a reasonable PE might be once factors such as the company’s expected earnings growth, profitability, risk profile, industry positioning and market cap are taken into account, making it more tailored than broad industry or peer benchmarks.
Set against this Fair Ratio of 28.4x, Chewy’s actual PE of 95.0x suggests the shares are pricing in a lot of optimism and look expensive on an earnings basis.
Result: OVERVALUED

PE ratios tell one story, but what if the real opportunity lies elsewhere? Discover 1453 companies where insiders are betting big on explosive growth.
Upgrade Your Decision Making: Choose your Chewy Narrative
Earlier we mentioned that there is an even better way to understand valuation. Let us introduce you to Narratives, a simple framework on Simply Wall St’s Community page that lets you attach your own story about Chewy’s future revenue, earnings and margins to a financial forecast. You can then translate that into a Fair Value and compare it to today’s share price to decide whether to buy, hold or sell. Your Narrative automatically updates as new news or earnings arrive. Some investors currently use a more optimistic Chewy Narrative that assumes vet clinics, Chewy Plus membership and ad expansion justify a Fair Value closer to the bullish 52 dollars target. Others build a more cautious Narrative around slower customer growth and margin risk that anchors Fair Value nearer the bearish 33 dollars view.
Do you think there's more to the story for Chewy? Head over to our Community to see what others are saying!
This article by Simply Wall St is general in nature. We provide commentary based on historical data and analyst forecasts only using an unbiased methodology and our articles are not intended to be financial advice. It does not constitute a recommendation to buy or sell any stock, and does not take account of your objectives, or your financial situation. We aim to bring you long-term focused analysis driven by fundamental data. Note that our analysis may not factor in the latest price-sensitive company announcements or qualitative material. Simply Wall St has no position in any stocks mentioned.
Have feedback on this article? Concerned about the content? Get in touch with us directly. Alternatively, email editorial-team@simplywallst.com