
 Nasdaq
 華爾街日報
華爾街日報Is It Too Late To Consider JPMorgan After 2025 Rally And Digital Banking Expansion?
- If you are wondering whether JPMorgan Chase is still a smart buy after such a big run up, or if you are late to the party, you are in the right place to unpack what the market is really pricing in.
- The stock just closed at $315.21, up 2.0% over the last week and roughly flat over 30 days, but with a 31.3% gain year to date and 32.0% over the past year, compounding into a total return of 203.4% over 5 years.
- Recent headlines have focused on JPMorgan expanding its digital banking capabilities and strengthening its payments infrastructure, reinforcing its position as a scale leader in US and global banking. At the same time, ongoing regulatory debates around capital requirements and stress testing have kept risk and profitability firmly in the spotlight for investors trying to justify the current price.
- Using our framework, JPMorgan scores a 2 out of 6 on undervaluation checks. In this article we will walk through traditional valuation approaches such as discounted cash flow models and multiples, then circle back at the end to a more holistic way of thinking about what this price implies for the bank's long-term story.
JPMorgan Chase scores just 2/6 on our valuation checks. See what other red flags we found in the full valuation breakdown.
Approach 1: JPMorgan Chase Excess Returns Analysis
The Excess Returns model looks at how effectively a bank turns its shareholders’ equity into profits above the minimum return investors demand, then projects how long that value creation can continue.
For JPMorgan Chase, the starting point is a Book Value of $124.96 per share and a Stable EPS of $22.49 per share, based on weighted future Return on Equity estimates from 13 analysts. With an Average Return on Equity of 16.63% and a Stable Book Value projected to rise to $135.24 per share, the model reflects an assumption that JPMorgan can keep compounding value at attractive rates.
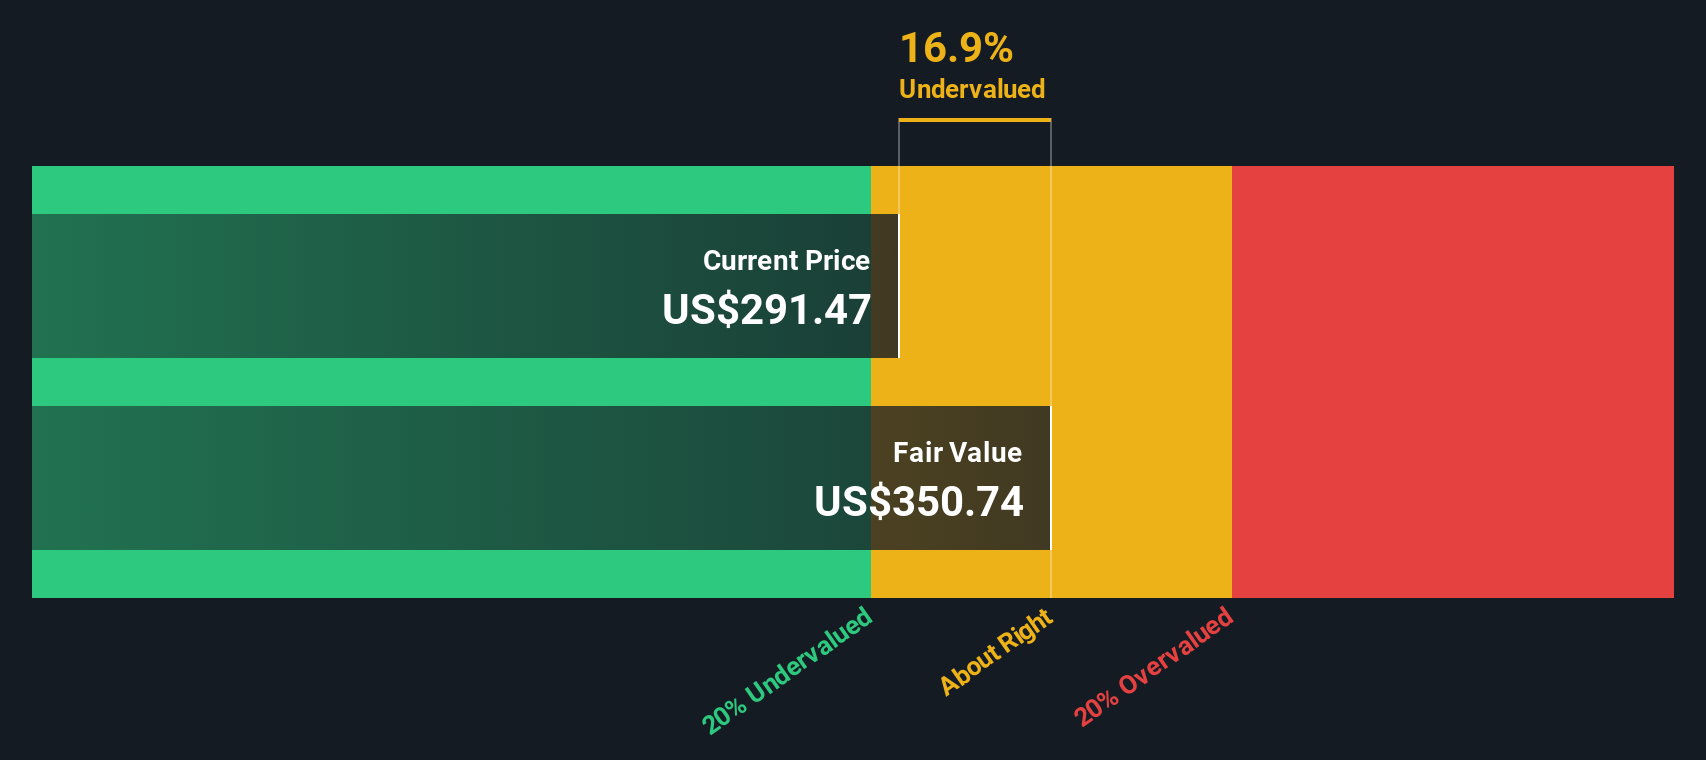
The Cost of Equity is estimated at $11.09 per share, while the Excess Return, the profit above that required return, is $11.41 per share. Capitalizing these excess returns over time gives an intrinsic value of about $366.26 per share. This indicates the stock is estimated to be roughly 13.9% undervalued versus the current price.
In plain terms, this framework suggests the market is not fully pricing in JPMorgan’s ability to earn above its cost of capital over an extended period.
Result: UNDERVALUED
Our Excess Returns analysis suggests JPMorgan Chase is undervalued by 13.9%. Track this in your watchlist or portfolio, or discover 903 more undervalued stocks based on cash flows.
Approach 2: JPMorgan Chase Price vs Earnings
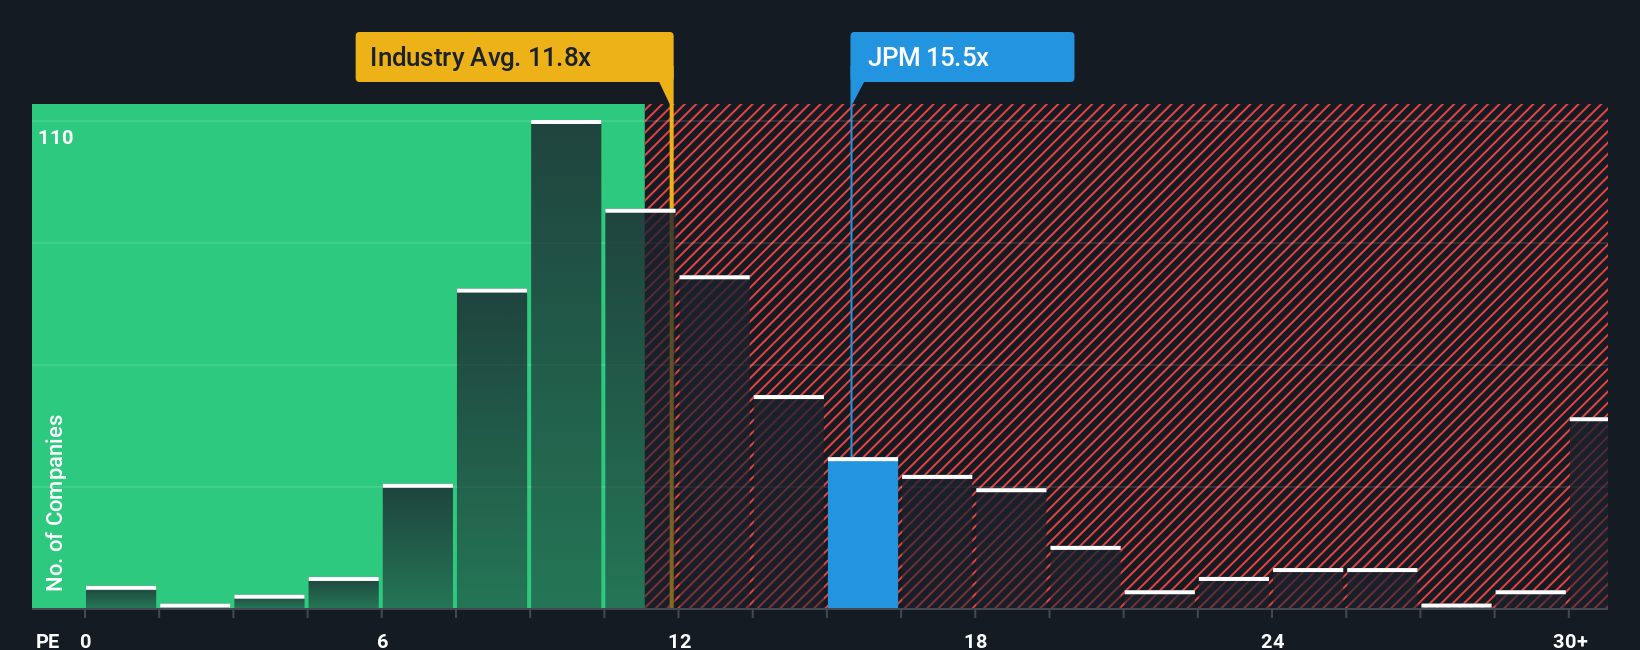
For a profitable bank like JPMorgan, the price to earnings ratio is a natural way to gauge value because it links what investors pay today to the profits the business is already generating. In general, faster earnings growth and lower perceived risk justify a higher PE, while slower growth or higher uncertainty should mean a lower, more conservative multiple.
JPMorgan currently trades on a PE of 15.14x. That is above the broader Banks industry average of 11.64x, and also ahead of the peer average of 13.58x. This might suggest a premium valuation at first glance. However, Simply Wall St’s Fair Ratio framework, which estimates what PE the stock deserves given its growth outlook, profitability, risk profile, size and industry, points to a Fair Ratio of 15.49x.
Because this Fair Ratio is tailored to JPMorgan’s specific fundamentals rather than broad peer groups, it is a more precise anchor for valuation. With the stock’s actual PE of 15.14x sitting very close to the Fair Ratio of 15.49x, the shares appear reasonably priced on an earnings multiple basis.
Result: ABOUT RIGHT
PE ratios tell one story, but what if the real opportunity lies elsewhere? Discover 1452 companies where insiders are betting big on explosive growth.
Upgrade Your Decision Making: Choose your JPMorgan Chase Narrative
Earlier we mentioned that there is an even better way to understand valuation, so let us introduce you to Narratives. This is a simple way to turn your view of JPMorgan Chase into a story that links its business strengths and risks to a forecast for revenue, earnings and margins, and then to your own fair value. All of this is inside the Simply Wall St Community page that millions of investors use to quickly see whether their Narrative says the stock is above or below today’s price, and to have that view automatically updated when fresh news or earnings arrive so they can decide when to buy or sell. Investors can lean more toward an optimistic JPMorgan case where digital banking, payments and wealth leadership justify a fair value closer to 350 dollars per share, or toward a more cautious stance that focuses on rising expenses, regulation and credit risk and lands nearer 247 dollars per share instead.
For JPMorgan Chase however we will make it really easy for you with previews of two leading JPMorgan Chase Narratives:
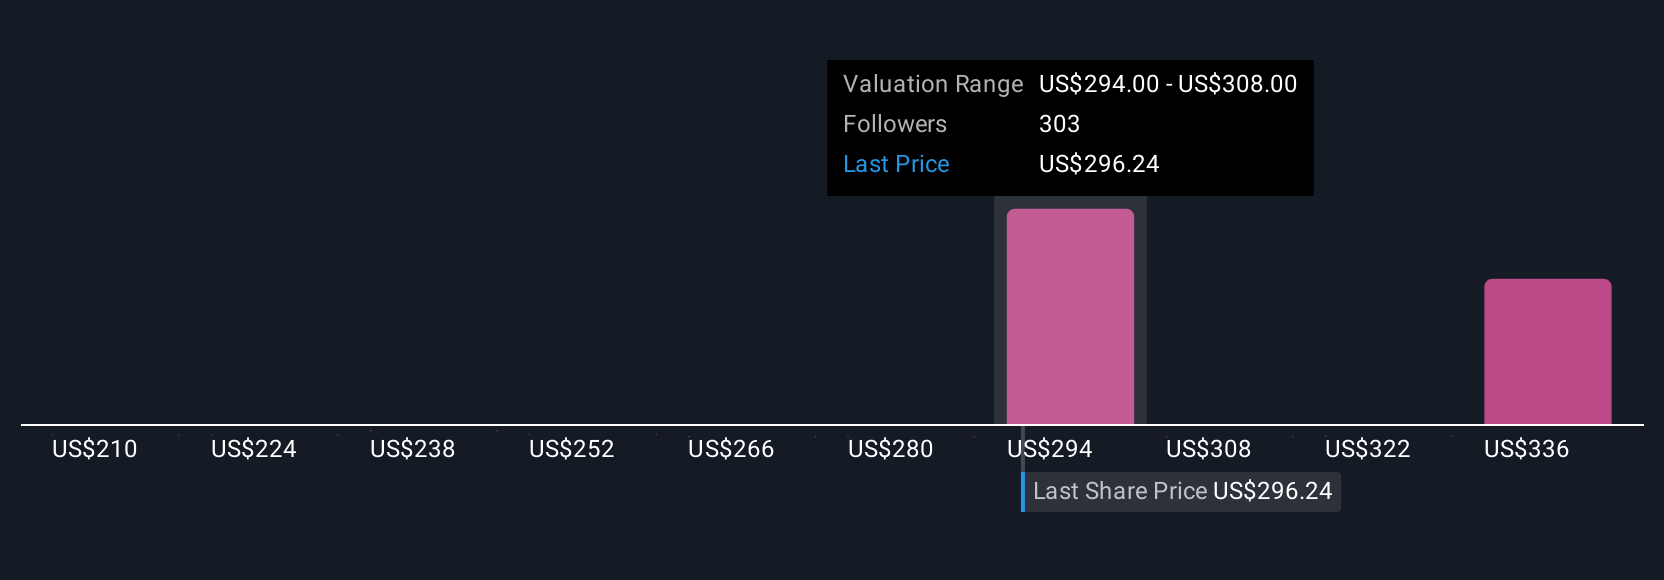
Fair value: $328.09 per share
Implied undervaluation: 3.9%
Revenue growth assumption: 6.09%
- Analysts see broad based strength in wealth, asset management, cards and payments driving resilient fee income and long term earnings growth.
- Scale, diversified business lines and heavy investment in digital banking, tokenization and new payment rails are expected to sustain high ROTCE and support a premium PE of around 17.7x.
- Key risks include accelerating fintech disruption, tighter capital and liquidity rules, and potential margin pressure from regulation and product commoditization.
Fair value: $247.02 per share
Implied overvaluation: 27.6%
Revenue growth assumption: 4.08%
- More cautious analysts focus on rising credit loss allowances, higher operating expenses and reserve builds that could weigh on net and operating margins.
- Expected rate cuts and a subdued investment banking backdrop may cap net interest income and advisory fees, limiting earnings growth even as the franchise remains strong.
- On this view, JPMorgan still grows but deserves only a mid teens forward PE, which implies meaningful downside from today’s share price if optimism on margins and credit proves too high.
Do you think there's more to the story for JPMorgan Chase? Head over to our Community to see what others are saying!
This article by Simply Wall St is general in nature. We provide commentary based on historical data and analyst forecasts only using an unbiased methodology and our articles are not intended to be financial advice. It does not constitute a recommendation to buy or sell any stock, and does not take account of your objectives, or your financial situation. We aim to bring you long-term focused analysis driven by fundamental data. Note that our analysis may not factor in the latest price-sensitive company announcements or qualitative material. Simply Wall St has no position in any stocks mentioned.
Have feedback on this article? Concerned about the content? Get in touch with us directly. Alternatively, email editorial-team@simplywallst.com