
 Nasdaq
 華爾街日報
華爾街日報Smart Sand (SND): Valuation Check as Shares Hit Multi‑Year Highs on Strong Frac Sand Demand
The latest buzz around Smart Sand (SND) stems from its shares pushing to fresh multi year highs, as sustained demand for northern white fracking sand and related logistics keeps investors focused on the company.
See our latest analysis for Smart Sand.
The surge to a $3.89 share price caps an impressive run, with an 86.12% 1 month share price return and a 168.58% 3 year total shareholder return signalling that momentum is firmly building rather than fading.
If this proppant rally has you rethinking your playbook, it could be a smart moment to explore fast growing stocks with high insider ownership as potential next wave opportunities.
With Smart Sand now trading near fresh highs despite modest recent profits, the key question is whether the market is underestimating its embedded earnings power or already pricing in years of proppant-fueled growth.
Price-to-Earnings of 43.4x: Is it justified?
Smart Sand's recent close at $3.89 comes with a lofty price-to-earnings ratio of 43.4x, putting the stock on a rich valuation footing versus peers.
The price-to-earnings multiple compares the share price to the company’s earnings per share, making it a simple way to gauge how much investors are paying for each dollar of profit. For a cyclical, capital intensive energy services and proppant logistics business like Smart Sand, this measure often reflects how sustainable investors believe current profitability will be through commodity and activity cycles.
In this case, the market is assigning Smart Sand a premium valuation that appears to run ahead of its recent earnings profile. The company has only just returned to profitability, its return on equity sits at a low 1.6 percent, and reported earnings have been flattered by a sizable one off gain, which suggests investors may be paying up for a level of normalized profitability that is not yet evident in the historical numbers.
The premium stands out sharply when stacked against benchmarks, with Smart Sand’s 43.4x price-to-earnings multiple towering over both the US Energy Services industry average of 18.3x and the 21.8x peer group average. This gap implies the market is baking in meaningfully stronger or more resilient earnings than are currently visible on the income statement.
See what the numbers say about this price — find out in our valuation breakdown.
Result: Price-to-earnings of 43.4x (OVERVALUED)
However, stretched valuation and reliance on buoyant frac activity mean that any slowdown in drilling or pricing pressure could quickly puncture the current optimism.
Find out about the key risks to this Smart Sand narrative.
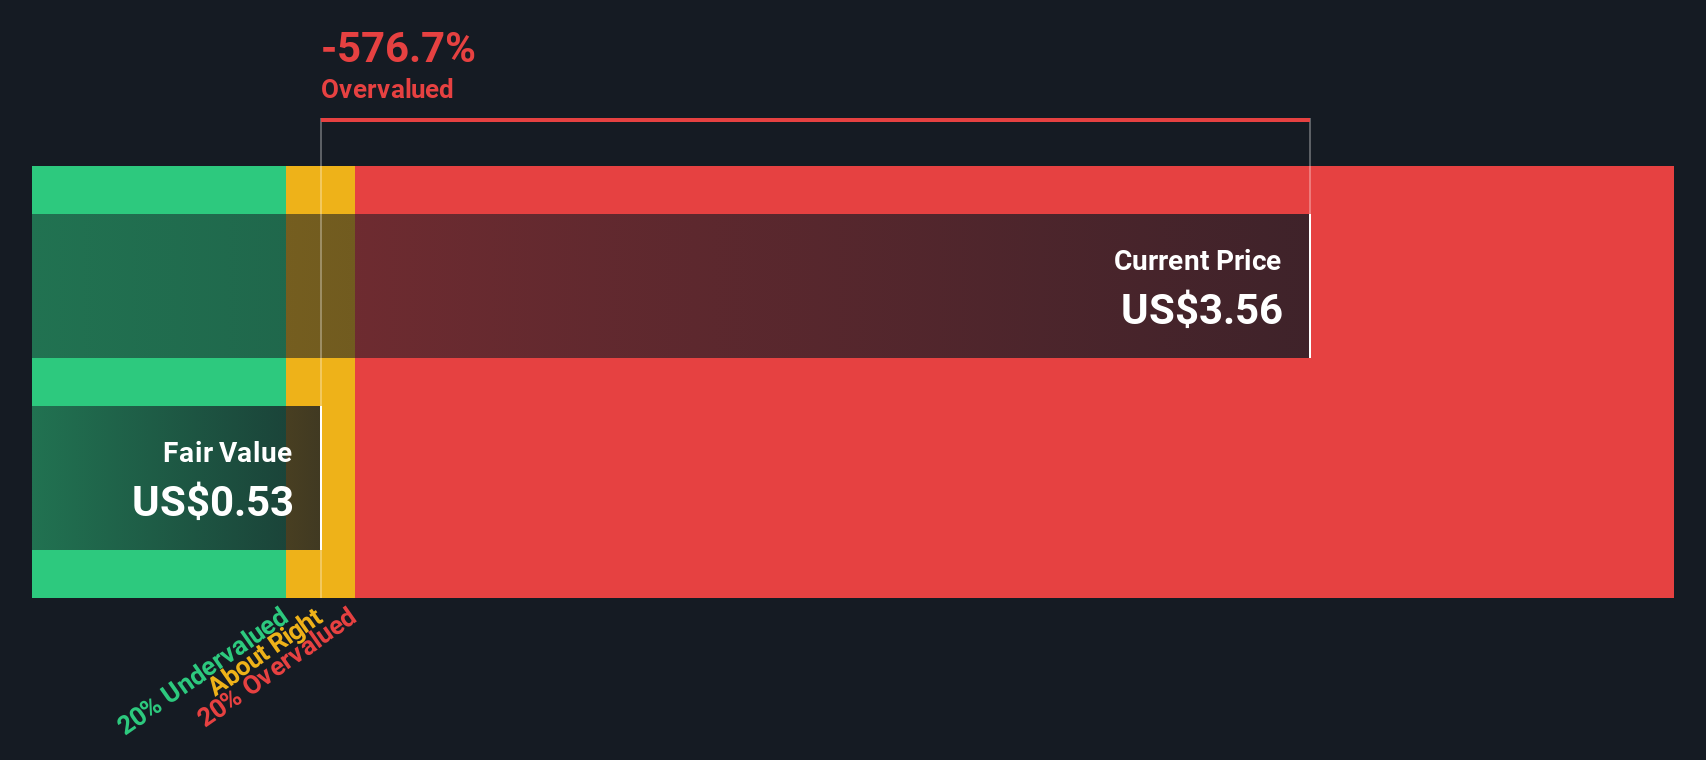
Another View: DCF Flags Even Richer Pricing
While the 43.4x price to earnings ratio already looks stretched, our DCF model is even harsher. It suggests fair value closer to $0.53, well below the current $3.89 share price. If both earnings and cash flow lenses indicate overvaluation, what exactly is the market betting on?
Look into how the SWS DCF model arrives at its fair value.
Simply Wall St performs a discounted cash flow (DCF) on every stock in the world every day (check out Smart Sand for example). We show the entire calculation in full. You can track the result in your watchlist or portfolio and be alerted when this changes, or use our stock screener to discover 905 undervalued stocks based on their cash flows. If you save a screener we even alert you when new companies match - so you never miss a potential opportunity.
Build Your Own Smart Sand Narrative
If you see the numbers differently or want to stress test your own assumptions, you can build a full narrative from scratch in minutes: Do it your way.
A great starting point for your Smart Sand research is our analysis highlighting 1 key reward and 2 important warning signs that could impact your investment decision.
Looking for more investment ideas?
Smart moves rarely come from watching a single stock, so put your research to work and use focused screeners to spot the next opportunity before everyone else.
- Capture potential turnaround stories by targeting quality names trading below intrinsic value with these 905 undervalued stocks based on cash flows built from cash flow analysis.
- Look for structural trends in automation and data by filtering for standout innovators through these 26 AI penny stocks with momentum and earnings strength.
- Strengthen your income base by focusing on reliable payers using these 15 dividend stocks with yields > 3% where yields clear the 3 percent hurdle.
This article by Simply Wall St is general in nature. We provide commentary based on historical data and analyst forecasts only using an unbiased methodology and our articles are not intended to be financial advice. It does not constitute a recommendation to buy or sell any stock, and does not take account of your objectives, or your financial situation. We aim to bring you long-term focused analysis driven by fundamental data. Note that our analysis may not factor in the latest price-sensitive company announcements or qualitative material. Simply Wall St has no position in any stocks mentioned.
Have feedback on this article? Concerned about the content? Get in touch with us directly. Alternatively, email editorial-team@simplywallst.com