
 Nasdaq
 華爾街日報
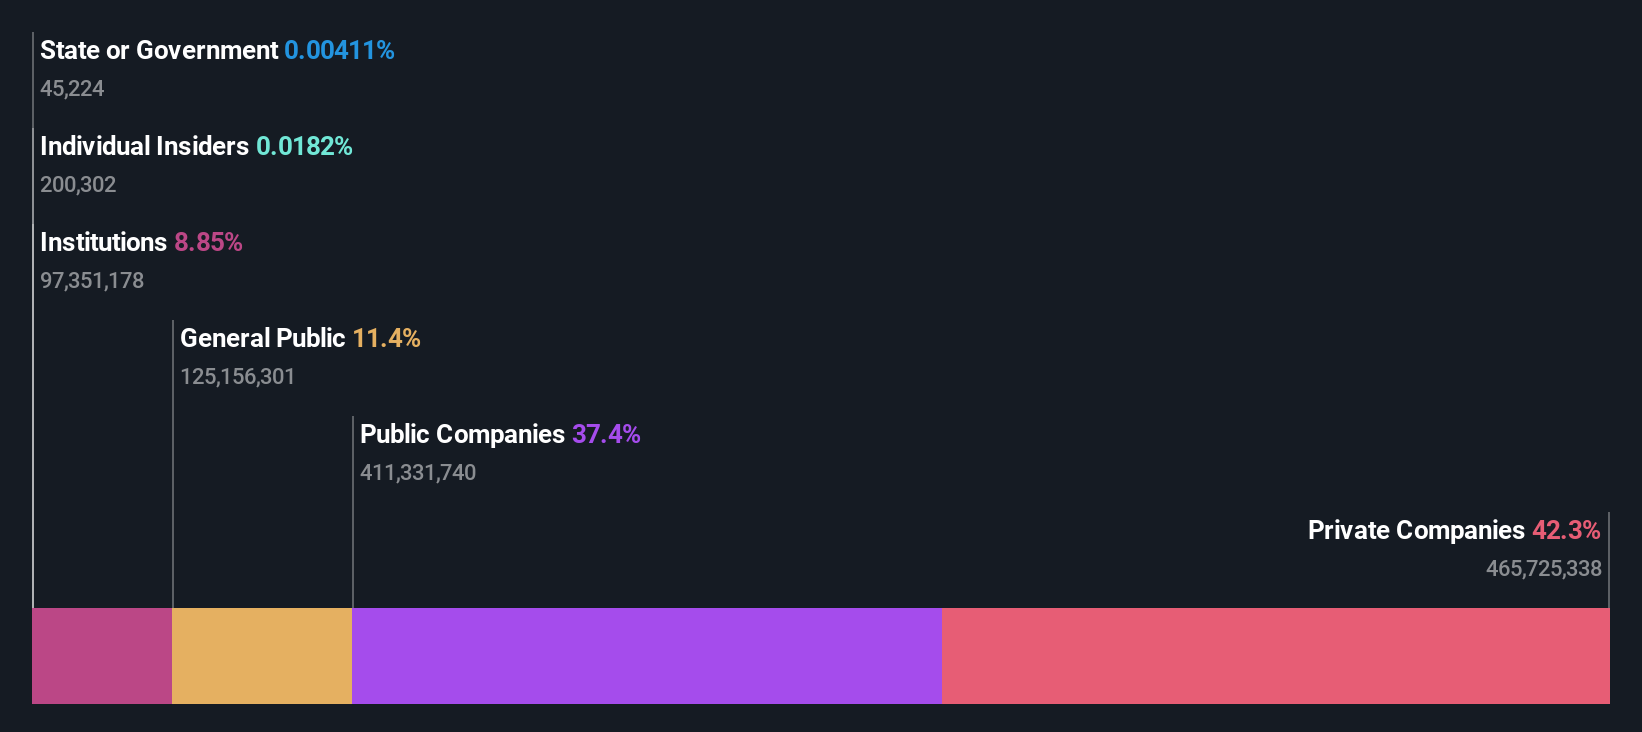
華爾街日報Adani Total Gas Limited's (NSE:ATGL) largest shareholders are private companies with 42% ownership, public companies own 37%
Key Insights
- Adani Total Gas' significant private companies ownership suggests that the key decisions are influenced by shareholders from the larger public
- 75% of the business is held by the top 2 shareholders
- Ownership research, combined with past performance data can help provide a good understanding of opportunities in a stock
A look at the shareholders of Adani Total Gas Limited (NSE:ATGL) can tell us which group is most powerful. And the group that holds the biggest piece of the pie are private companies with 42% ownership. That is, the group stands to benefit the most if the stock rises (or lose the most if there is a downturn).
And public companies on the other hand have a 37% ownership in the company.
In the chart below, we zoom in on the different ownership groups of Adani Total Gas.
View our latest analysis for Adani Total Gas
What Does The Institutional Ownership Tell Us About Adani Total Gas?
Many institutions measure their performance against an index that approximates the local market. So they usually pay more attention to companies that are included in major indices.
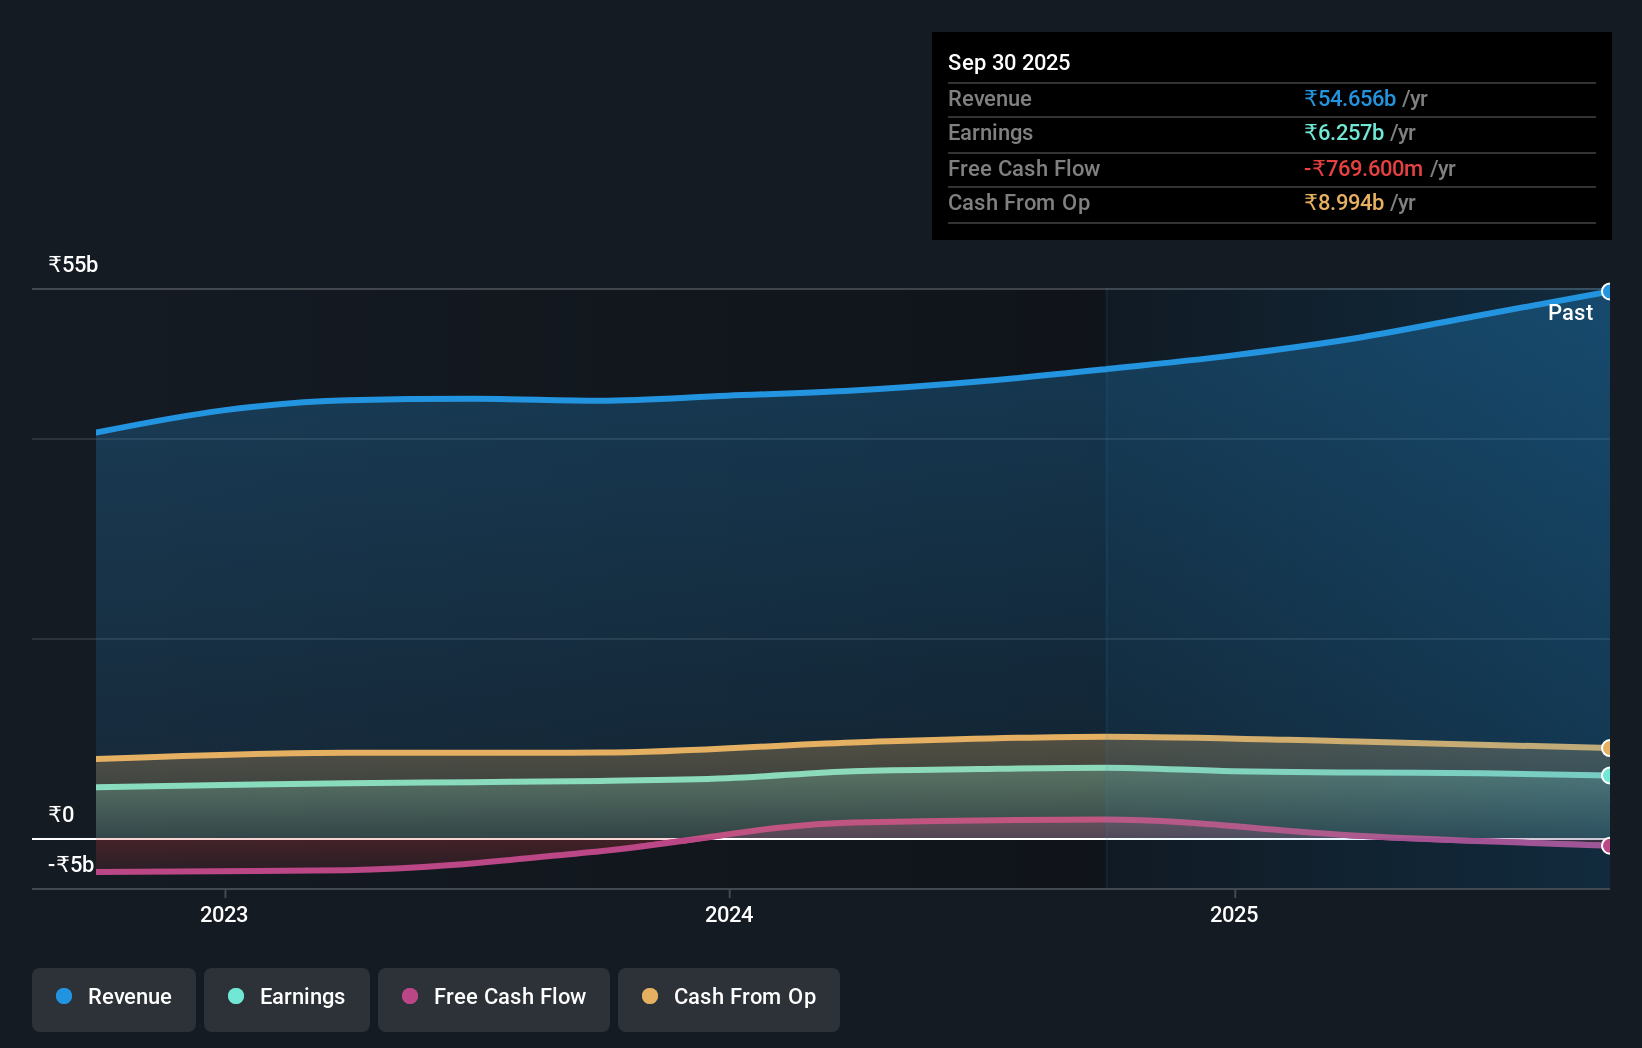
As you can see, institutional investors have a fair amount of stake in Adani Total Gas. This implies the analysts working for those institutions have looked at the stock and they like it. But just like anyone else, they could be wrong. It is not uncommon to see a big share price drop if two large institutional investors try to sell out of a stock at the same time. So it is worth checking the past earnings trajectory of Adani Total Gas, (below). Of course, keep in mind that there are other factors to consider, too.
We note that hedge funds don't have a meaningful investment in Adani Total Gas. Our data shows that TotalEnergies SE is the largest shareholder with 37% of shares outstanding. Meanwhile, the second and third largest shareholders, hold 37% and 6.0%, of the shares outstanding, respectively.
After doing some more digging, we found that the top 2 shareholders collectively control more than half of the company's shares, implying that they have considerable power to influence the company's decisions.
While it makes sense to study institutional ownership data for a company, it also makes sense to study analyst sentiments to know which way the wind is blowing. We're not picking up on any analyst coverage of the stock at the moment, so the company is unlikely to be widely held.
Insider Ownership Of Adani Total Gas
While the precise definition of an insider can be subjective, almost everyone considers board members to be insiders. Management ultimately answers to the board. However, it is not uncommon for managers to be executive board members, especially if they are a founder or the CEO.
Most consider insider ownership a positive because it can indicate the board is well aligned with other shareholders. However, on some occasions too much power is concentrated within this group.
Our data suggests that insiders own under 1% of Adani Total Gas Limited in their own names. But they may have an indirect interest through a corporate structure that we haven't picked up on. It's a big company, so even a small proportional interest can create alignment between the board and shareholders. In this case insiders own ₹119m worth of shares. It is always good to see at least some insider ownership, but it might be worth checking if those insiders have been selling.
General Public Ownership
With a 11% ownership, the general public, mostly comprising of individual investors, have some degree of sway over Adani Total Gas. While this size of ownership may not be enough to sway a policy decision in their favour, they can still make a collective impact on company policies.
Private Company Ownership
Our data indicates that Private Companies hold 42%, of the company's shares. Private companies may be related parties. Sometimes insiders have an interest in a public company through a holding in a private company, rather than in their own capacity as an individual. While it's hard to draw any broad stroke conclusions, it is worth noting as an area for further research.
Public Company Ownership
It appears to us that public companies own 37% of Adani Total Gas. It's hard to say for sure but this suggests they have entwined business interests. This might be a strategic stake, so it's worth watching this space for changes in ownership.
Next Steps:
I find it very interesting to look at who exactly owns a company. But to truly gain insight, we need to consider other information, too. Case in point: We've spotted 1 warning sign for Adani Total Gas you should be aware of.
If you would prefer check out another company -- one with potentially superior financials -- then do not miss this free list of interesting companies, backed by strong financial data.
NB: Figures in this article are calculated using data from the last twelve months, which refer to the 12-month period ending on the last date of the month the financial statement is dated. This may not be consistent with full year annual report figures.
Have feedback on this article? Concerned about the content? Get in touch with us directly. Alternatively, email editorial-team (at) simplywallst.com.
This article by Simply Wall St is general in nature. We provide commentary based on historical data and analyst forecasts only using an unbiased methodology and our articles are not intended to be financial advice. It does not constitute a recommendation to buy or sell any stock, and does not take account of your objectives, or your financial situation. We aim to bring you long-term focused analysis driven by fundamental data. Note that our analysis may not factor in the latest price-sensitive company announcements or qualitative material. Simply Wall St has no position in any stocks mentioned.