
 Nasdaq
 華爾街日報
華爾街日報Is It Too Late to Consider Invesco After Its 48.7% Rally in 2025?
- Wondering if Invesco is still a smart buy after its big run up, or if you have missed the boat? This breakdown will help you decide whether the current price really makes sense.
- Invesco has quietly put together an impressive stretch, with the stock up 7.3% over the last week, 12.3% over the past month, and a hefty 48.7% gain year to date. That translates into a 53.7% rise over the last year and 80.9% over five years.
- Behind these moves, investors have been responding to shifting market sentiment toward diversified financials, including flows into asset managers as confidence in capital markets has improved. More recently, headlines around industry wide consolidation and fee pressure have also influenced how the market is thinking about future profitability and growth for firms like Invesco.
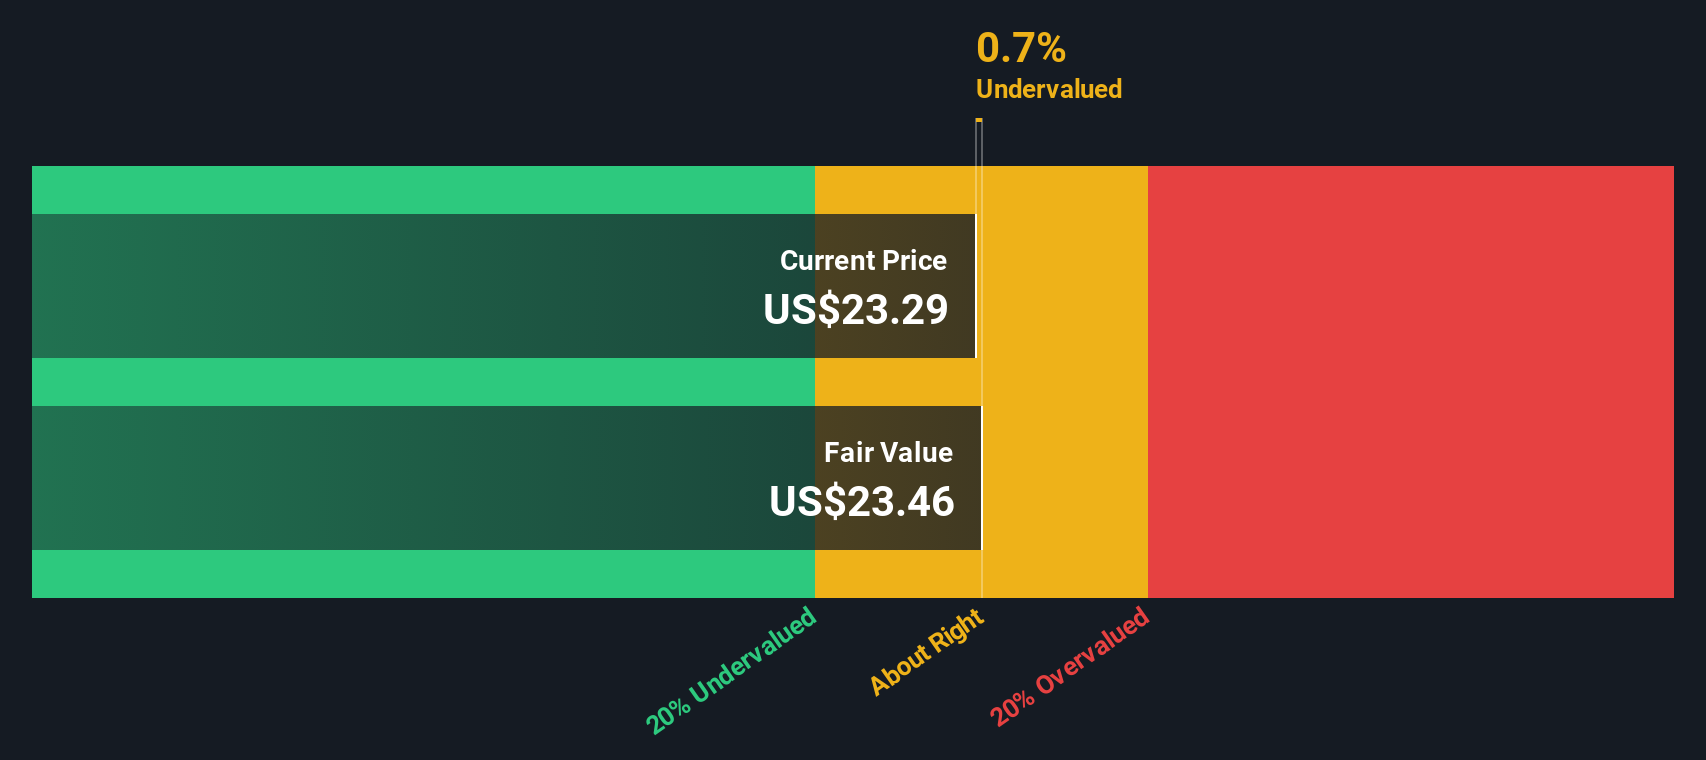
- Despite the rally, Invesco only scores 2/6 on our valuation checks. This suggests it looks undervalued on just a couple of metrics while looking less compelling on others. Next we will unpack what the main valuation approaches say about the stock, and then circle back at the end to an even more practical way to think about Invesco's true value.
Invesco scores just 2/6 on our valuation checks. See what other red flags we found in the full valuation breakdown.
Approach 1: Invesco Excess Returns Analysis
The Excess Returns model evaluates how much profit a company generates above the minimum return that shareholders require, relative to its equity base. If a firm consistently earns returns on equity that are only slightly above, or even below, its cost of equity, its capacity to create long term value is limited.
For Invesco, the model uses a Book Value of $24.70 per share and a Stable EPS estimate of $1.20 per share, derived from the median return on equity over the past five years. The Average Return on Equity is 5.03%, while the Cost of Equity is estimated at $2.03 per share. That leaves an Excess Return of $-0.83 per share, implying Invesco is not expected to earn sufficiently above its cost of capital on a sustained basis. A Stable Book Value of $23.95 per share supports this subdued outlook.
Putting these inputs together, the Excess Returns valuation produces an intrinsic value that is far below the current share price, implying the stock is about 224.0% overvalued on this framework.
Result: OVERVALUED
Our Excess Returns analysis suggests Invesco may be overvalued by 224.0%. Discover 906 undervalued stocks or create your own screener to find better value opportunities.
Approach 2: Invesco Price vs Earnings
For a profitable business like Invesco, the price to earnings, or PE, ratio is a practical way to judge value because it directly links what investors pay for each share to the earnings that support that price. In general, companies with stronger and more reliable growth, cleaner balance sheets, and lower risk profiles can justify a higher PE. By contrast, slower growth or higher uncertainty should translate into a lower, more conservative multiple.
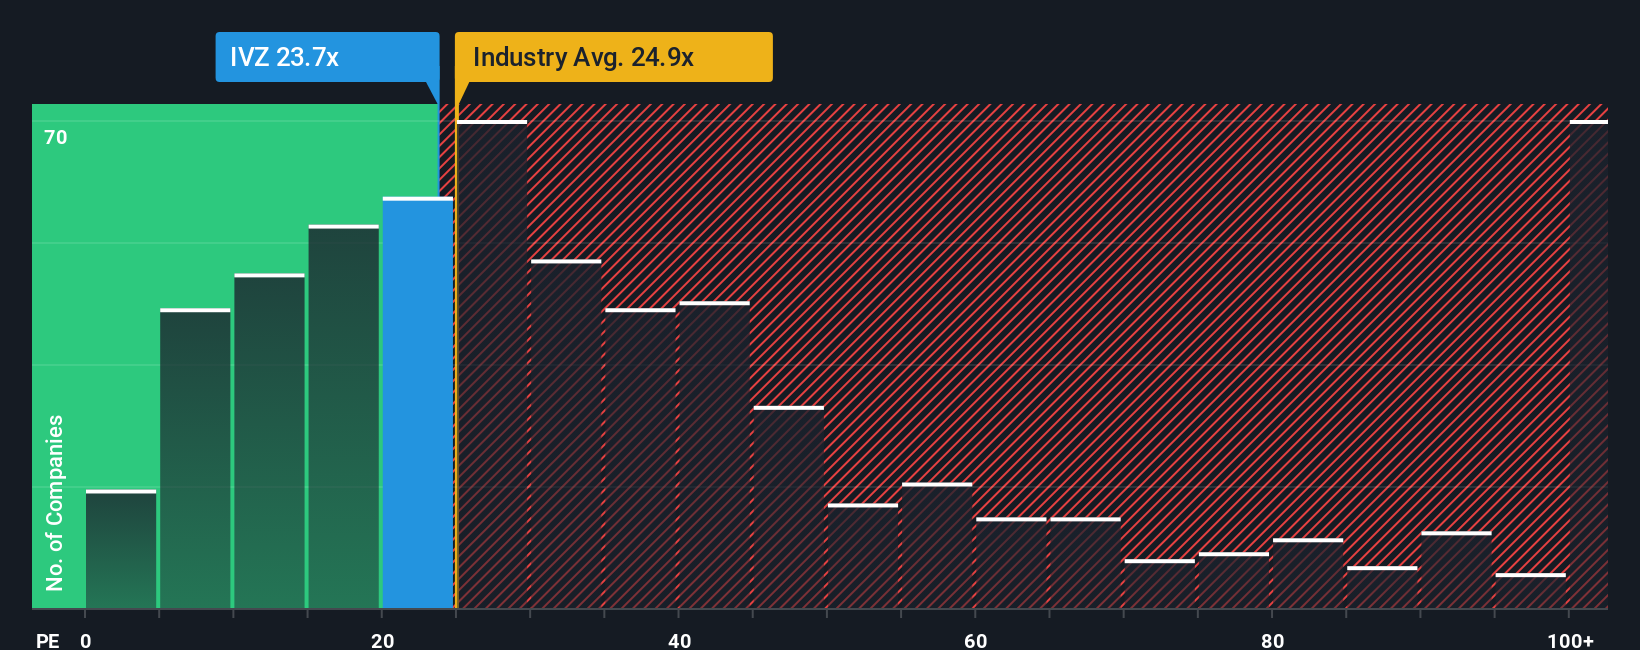
Invesco currently trades at about 17.45x earnings, which is slightly above the peer average of 16.87x but well below the broader Capital Markets industry average of 24.21x. To move beyond these blunt comparisons, Simply Wall St estimates a Fair Ratio of 19.16x for Invesco. This proprietary measure blends company specific factors such as expected earnings growth, profitability, risk profile, industry dynamics, and market capitalization into a single benchmark.
Because the Fair Ratio is tailored to Invesco’s own fundamentals, it is a more nuanced yardstick than simply lining the stock up against peers or the sector. With the current PE of 17.45x sitting below the Fair Ratio of 19.16x, this multiple-based view suggests that Invesco still has some valuation upside.
Result: UNDERVALUED
PE ratios tell one story, but what if the real opportunity lies elsewhere? Discover 1442 companies where insiders are betting big on explosive growth.
Upgrade Your Decision Making: Choose your Invesco Narrative
Earlier we mentioned that there is an even better way to understand valuation. Let us introduce you to Narratives, a simple way to connect your view of Invesco’s story with a financial forecast and a clear fair value, by letting you define what you think will happen to its revenue, earnings and margins, and then comparing that fair value to today’s price to help inform your decisions.
On Simply Wall St’s Community page, which is used by millions of investors, Narratives make this process accessible and dynamic. They continuously update your fair value when new information such as earnings results or major news arrives, so your thesis is never static or out of date.
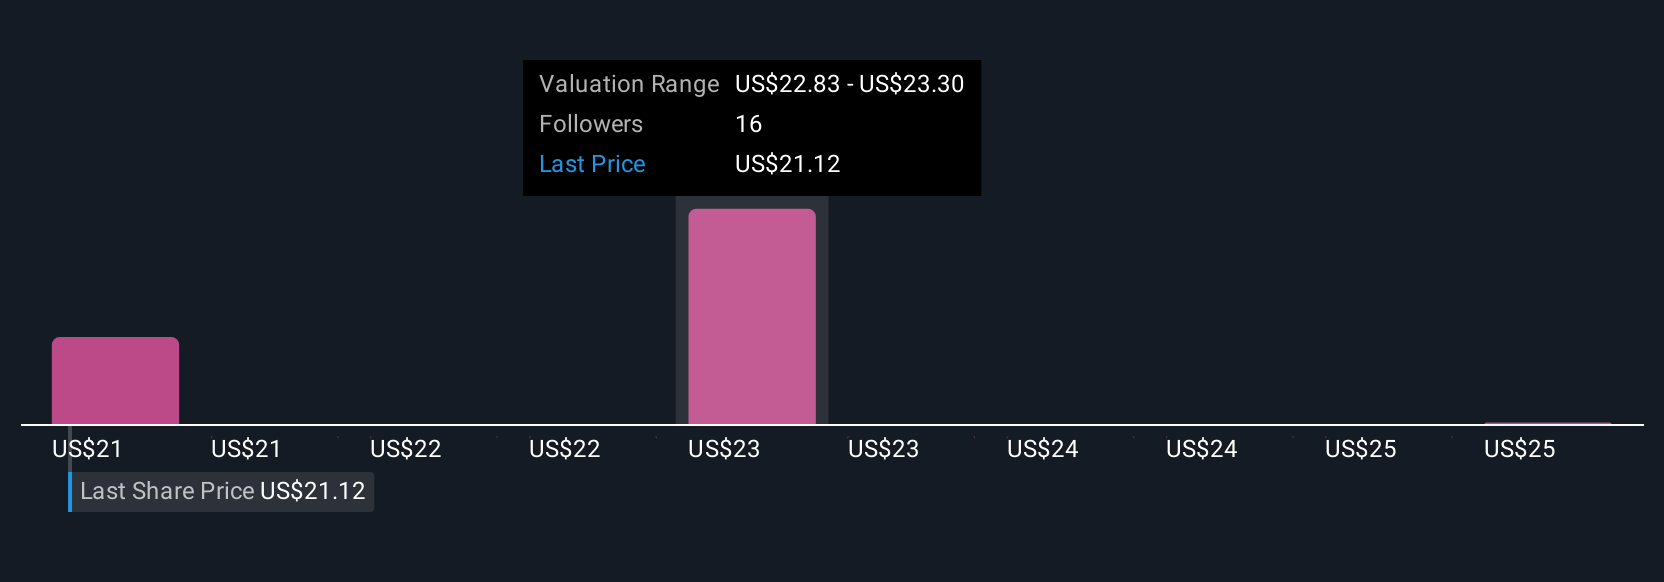
For example, one Invesco investor might build a Narrative around margin expansion and operating leverage that supports a fair value near the higher end of current targets. Another might focus on fee pressure, slower revenue growth and competitive threats, leading to a more cautious fair value closer to the low end. These two Narratives can coexist side by side, each transparently linking assumptions to numbers and to a decision point.
Do you think there's more to the story for Invesco? Head over to our Community to see what others are saying!
This article by Simply Wall St is general in nature. We provide commentary based on historical data and analyst forecasts only using an unbiased methodology and our articles are not intended to be financial advice. It does not constitute a recommendation to buy or sell any stock, and does not take account of your objectives, or your financial situation. We aim to bring you long-term focused analysis driven by fundamental data. Note that our analysis may not factor in the latest price-sensitive company announcements or qualitative material. Simply Wall St has no position in any stocks mentioned.
Have feedback on this article? Concerned about the content? Get in touch with us directly. Alternatively, email editorial-team@simplywallst.com