
 Nasdaq
 華爾街日報
華爾街日報Interactive Brokers (IBKR): Assessing Valuation After Record Quarterly Results and Expanding Trading Offerings
Interactive Brokers Group (IBKR) just posted record quarterly results, powered by higher net interest income and commission revenue, as well as growing traction in crypto trading, forecast contracts, and overnight trading, putting its recent share moves into sharper context.
See our latest analysis for Interactive Brokers Group.
Even after a softer patch, including a roughly 9.9% 1 month share price return and a 7.2% 3 month share price return, the stock’s 41.4% year to date share price return and substantial multi year total shareholder returns suggest that underlying momentum is still firmly intact.
If strong brokerage earnings have you reconsidering the space, it may be worth widening the lens and exploring fast growing stocks with high insider ownership for other potential standouts.
Yet with the stock still below consensus price targets after a powerful multi year run, are investors being handed a rare chance to buy a quality compounder at a discount, or is the market already baking in years of growth?
Most Popular Narrative: 16.4% Undervalued
With Interactive Brokers Group last closing at $64.50 against a narrative fair value of $77.11, the prevailing view leans toward meaningful upside from here.
The ongoing popularity of investing with global interest from investors who increasingly want broad portfolios and international access is expected to drive sustained account growth, attracting both individual and institutional investors and boosting overall revenue.
Curious how steady, mid single digit growth assumptions end up supporting a premium earnings multiple usually reserved for faster growing sectors? The narrative quietly leans on rising margins, disciplined share count changes, and a higher future valuation multiple to justify that higher fair value. Want to see exactly how those moving parts combine into the current upside case?
Result: Fair Value of $77.11 (UNDERVALUED)
Have a read of the narrative in full and understand what's behind the forecasts.
However, sustained interest rate cuts or a sharp drop in trading volumes could undercut today’s bullish assumptions and challenge that implied premium valuation.
Find out about the key risks to this Interactive Brokers Group narrative.
Another View: Rich on Earnings
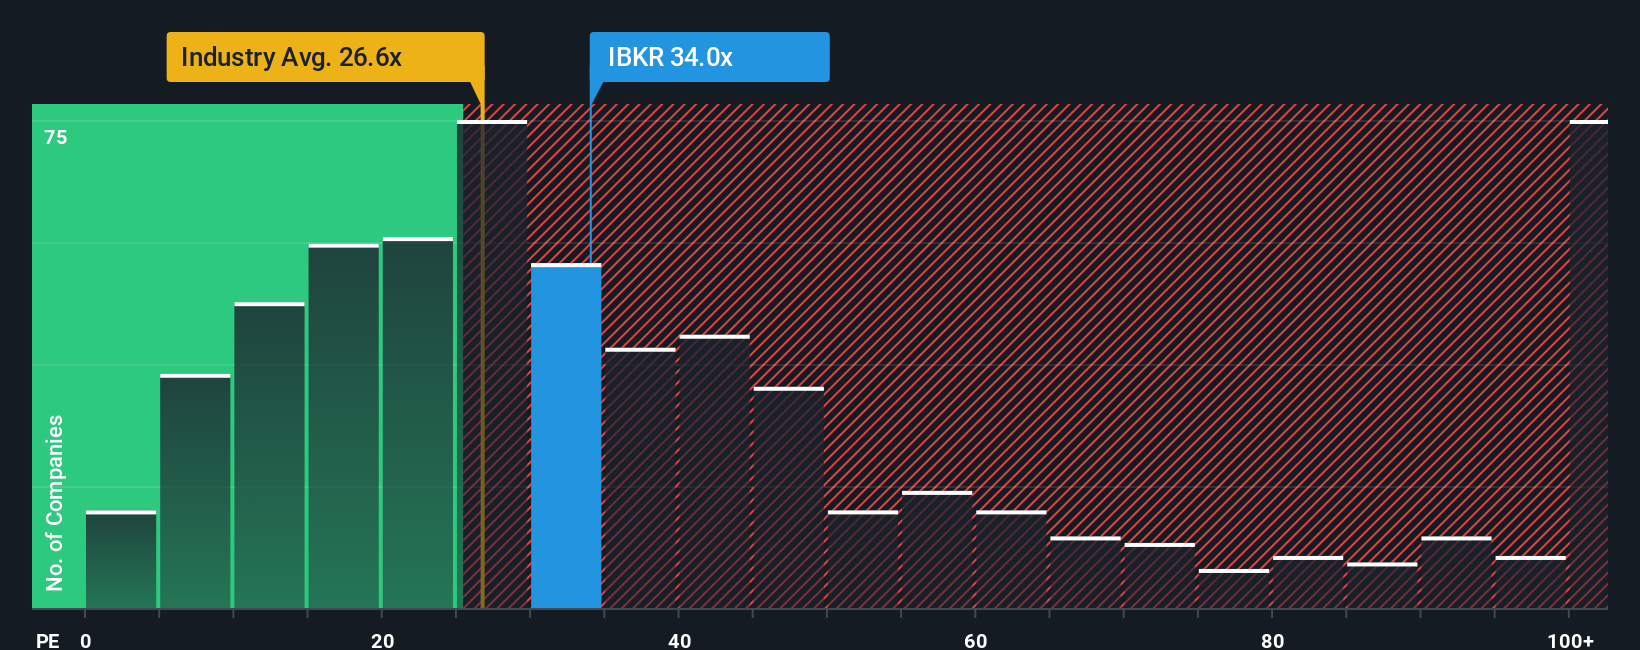
Our earnings based lens paints a very different picture. At 31.3 times earnings versus an industry average of 24.2 times and a fair ratio of 21.6 times, IBKR screens as expensive, raising the question of how much future growth is already priced in.
See what the numbers say about this price — find out in our valuation breakdown.
Build Your Own Interactive Brokers Group Narrative
If this perspective does not quite align with your own or you prefer hands on analysis, you can build a customized view in minutes: Do it your way.
A great starting point for your Interactive Brokers Group research is our analysis highlighting 2 key rewards and 1 important warning sign that could impact your investment decision.
Ready for more high conviction ideas?
Before markets move again, lock in your next watchlist upgrades with focused screeners that surface quality opportunities most investors overlook and help you stay a step ahead.
- Capture potential turnaround stories by scanning these 3576 penny stocks with strong financials that already show strengthening balance sheets and improving business momentum.
- Seek structural growth trends by targeting these 30 healthcare AI stocks that blend medical innovation with scalable, software-style economics.
- Explore income-focused ideas by filtering for these 15 dividend stocks with yields > 3% that aim to support payouts above inflation and through periods of market volatility.
This article by Simply Wall St is general in nature. We provide commentary based on historical data and analyst forecasts only using an unbiased methodology and our articles are not intended to be financial advice. It does not constitute a recommendation to buy or sell any stock, and does not take account of your objectives, or your financial situation. We aim to bring you long-term focused analysis driven by fundamental data. Note that our analysis may not factor in the latest price-sensitive company announcements or qualitative material. Simply Wall St has no position in any stocks mentioned.
Have feedback on this article? Concerned about the content? Get in touch with us directly. Alternatively, email editorial-team@simplywallst.com