
 Nasdaq
 華爾街日報
華爾街日報Does Halliburton’s Cash Flow Outlook Justify Its Recent 8.5% Share Price Jump?
- Wondering if Halliburton is quietly setting up as a value play in the energy space, or if the market already sees what you are seeing? Let us unpack what the current price is really telling us about future expectations.
- Over the last week the stock has climbed 8.5%, adding to a 5.0% gain over 30 days, while year to date it is up a more modest 2.6% and only 1.8% over the past year. Zooming out, the 3 year return is still negative at -7.7%, but the 5 year return of 57.0% shows long term holders have been rewarded.
- Recent moves in Halliburton have come against a backdrop of shifting sentiment in the oilfield services sector, as investors reassess capital spending cycles and long term demand for drilling and completion services. At the same time, ongoing conversations around energy security and disciplined production are nudging investors toward service providers that can grow cash flows without chasing uneconomic volume.
- Right now Halliburton scores a 4/6 on our valuation checks, suggesting several signals point to undervaluation, but not all are flashing green. Next we will walk through what those different valuation approaches say, and later in the article we will look at an even more powerful way to pull them together into a clearer view of what the stock might really be worth.
Find out why Halliburton's 1.8% return over the last year is lagging behind its peers.
Approach 1: Halliburton Discounted Cash Flow (DCF) Analysis
A Discounted Cash Flow, or DCF, model estimates what a company is worth by projecting the cash it can generate in the future and then discounting those cash flows back into today’s dollars.
For Halliburton, the latest twelve months Free Cash Flow is about $1.89 billion. Analysts and extrapolated forecasts point to Free Cash Flow rising toward roughly $2.4 billion by 2035, based on a 2 Stage Free Cash Flow to Equity model that blends explicit forecasts with longer term growth assumptions. Simply Wall St projects cash flows out over the next decade, then discounts each year back to the present to reflect risk and the time value of money.
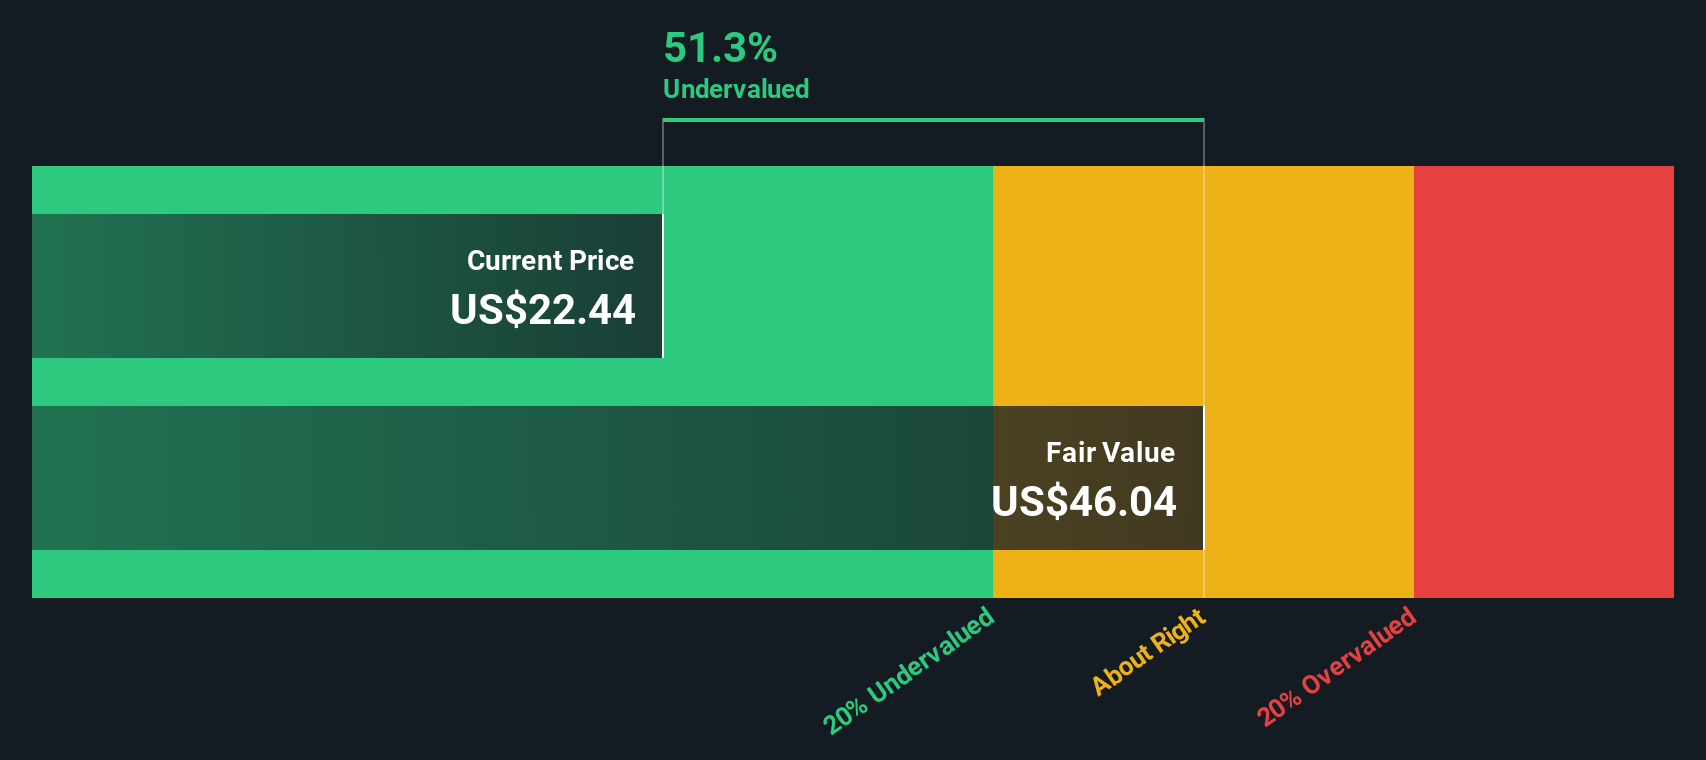
On this basis, the DCF model arrives at an intrinsic value of about $49.86 per share. Compared with the current market price, this implies the stock is trading at a 42.9% discount to its estimated fair value, indicating that the market may not be fully pricing in Halliburton’s future cash generation.
Result: UNDERVALUED
Our Discounted Cash Flow (DCF) analysis suggests Halliburton is undervalued by 42.9%. Track this in your watchlist or portfolio, or discover 906 more undervalued stocks based on cash flows.
Approach 2: Halliburton Price vs Earnings
For profitable companies like Halliburton, the Price to Earnings, or PE, ratio is a practical way to judge whether the market price makes sense relative to the profits the business is generating. In general, faster and more reliable earnings growth, plus lower perceived risk, tend to justify a higher, or more expensive, PE ratio, while slower growth or higher risk call for a lower multiple.
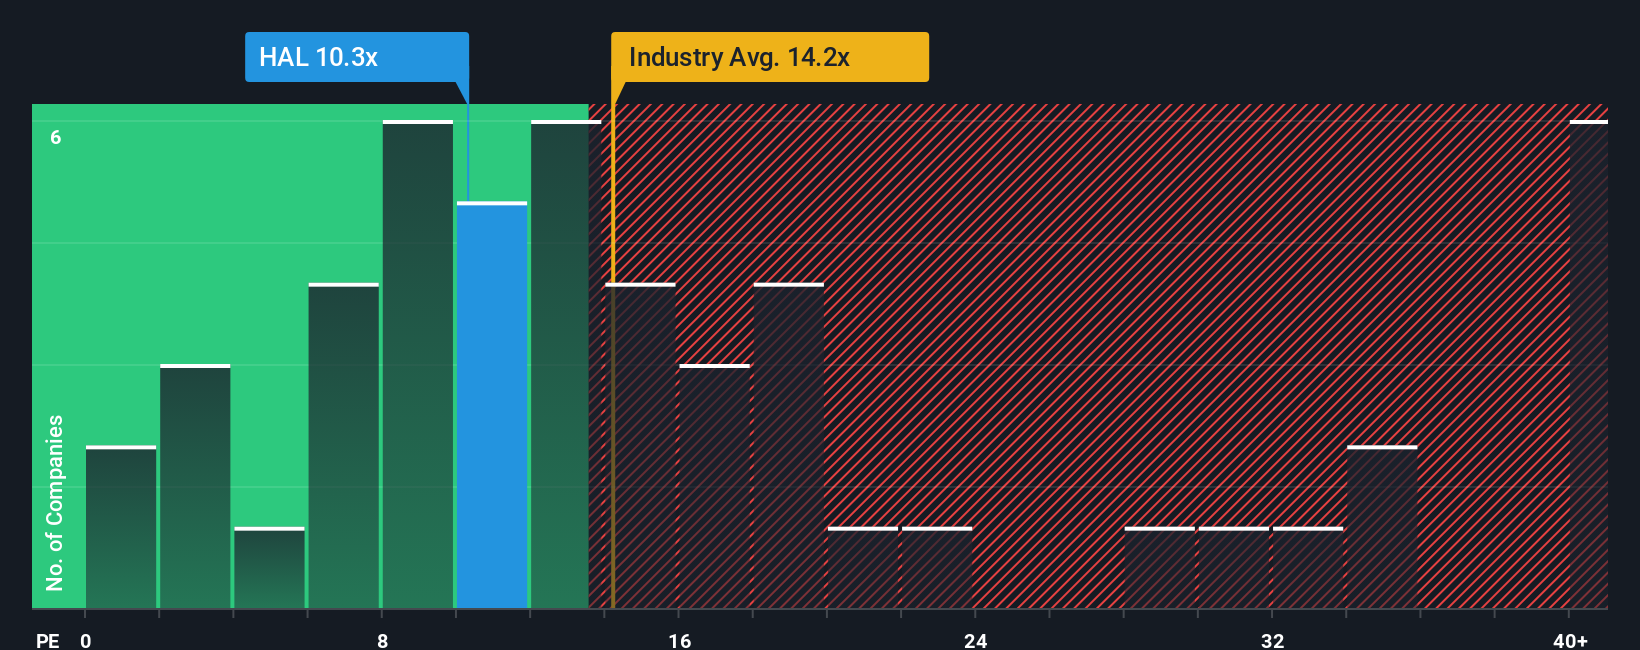
Halliburton currently trades on a PE of about 18.3x, which is in line with the wider Energy Services industry average of roughly 18.3x and modestly above the broader peer group average of around 16.8x. Simply Wall St goes a step further with its Fair Ratio, a proprietary estimate of what PE investors should be willing to pay given Halliburton’s specific earnings growth profile, margins, industry, market cap and risk factors. For Halliburton, that Fair Ratio is 20.6x, suggesting the stock deserves a somewhat higher multiple than it currently receives. On this basis, the market is pricing Halliburton slightly below what would be expected for its fundamentals, which points to a degree of undervaluation rather than overexuberance.
Result: UNDERVALUED
PE ratios tell one story, but what if the real opportunity lies elsewhere? Discover 1442 companies where insiders are betting big on explosive growth.
Upgrade Your Decision Making: Choose your Halliburton Narrative
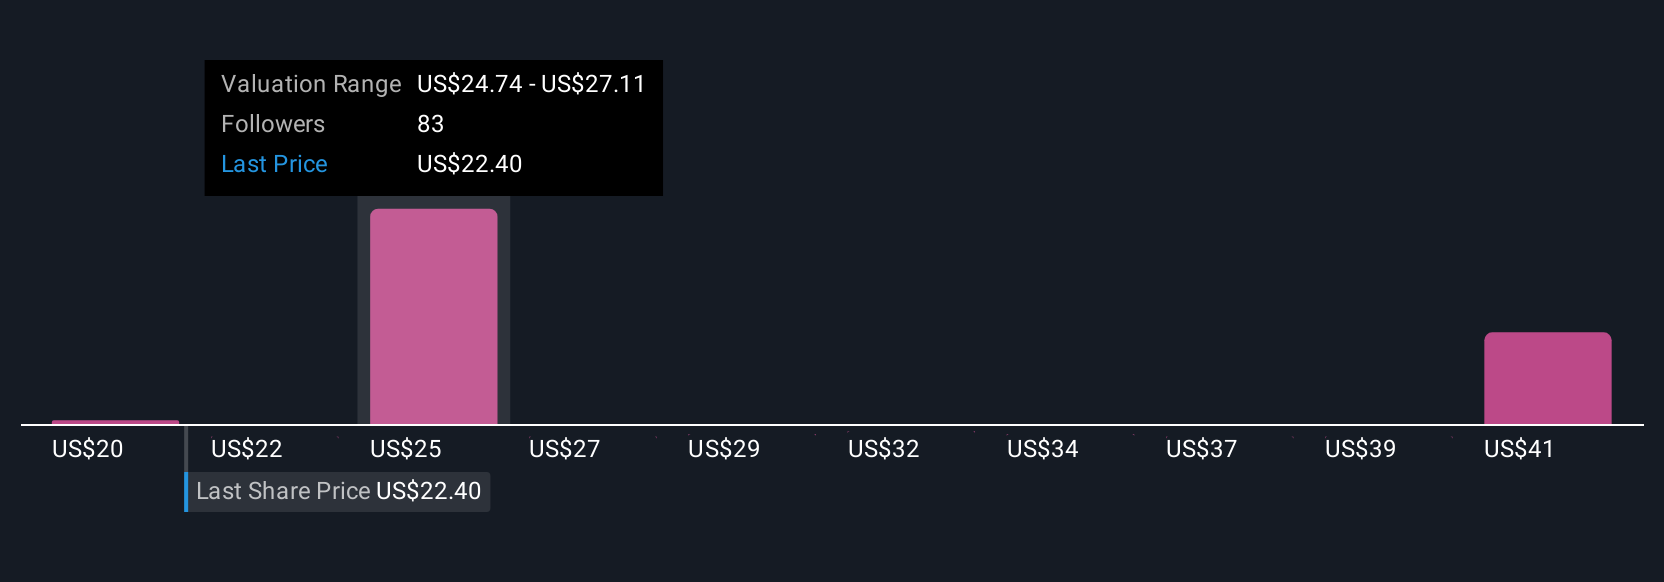
Earlier we mentioned that there is an even better way to understand valuation. Let us introduce you to Narratives, a simple tool on Simply Wall St’s Community page that lets you attach your own story about Halliburton’s future revenues, earnings and margins to a financial forecast, convert that into a Fair Value, and then continually compare it to the live share price so you can decide when to buy or sell. The system dynamically updates your Narrative as new news or earnings arrive, and different investors naturally land on different fair values. For example, a bullish view might hold that recent rating upgrades, international growth and data center exposure justify something closer to the top end of analyst targets around $35. A more cautious view might lean toward the lower end near $20 if energy transition, regulation and execution risks are expected to bite harder.
Do you think there's more to the story for Halliburton? Head over to our Community to see what others are saying!
This article by Simply Wall St is general in nature. We provide commentary based on historical data and analyst forecasts only using an unbiased methodology and our articles are not intended to be financial advice. It does not constitute a recommendation to buy or sell any stock, and does not take account of your objectives, or your financial situation. We aim to bring you long-term focused analysis driven by fundamental data. Note that our analysis may not factor in the latest price-sensitive company announcements or qualitative material. Simply Wall St has no position in any stocks mentioned.
Have feedback on this article? Concerned about the content? Get in touch with us directly. Alternatively, email editorial-team@simplywallst.com