
 Nasdaq
 華爾街日報
華爾街日報Has the Market Rerated Oceaneering After Its Big Multi Year Share Price Run?
- Wondering if Oceaneering International at around $26.94 is still a smart buy, or if the big gains are already in the rear view mirror? Let us unpack what the current price really implies about its value.
- The stock has climbed 10.4% over the last week and 16.3% over the past month, yet it is roughly flat year to date at -0.8% and over the last year at -0.6%, after a huge 100.6% 3 year and 228.5% 5 year run.
- Recent market attention has centered on Oceaneering's role in subsea services and robotics for offshore energy and defense, areas that have been getting more interest as offshore activity picks up and geopolitical risks stay elevated. Investors are also watching how its backlog and contract wins could translate into steadier cash flows, which matters a lot when we try to pin down fair value.
- Right now, Oceaneering scores a 4/6 valuation check score. This suggests it screens as undervalued on most of the metrics we track, but not all of them. In the sections that follow we will break down those different valuation approaches and, at the very end, look at a more nuanced way to think about what the stock is really worth.
Approach 1: Oceaneering International Discounted Cash Flow (DCF) Analysis
A Discounted Cash Flow model estimates what a company is worth today by projecting the cash it can generate in the future and discounting those cash flows back to the present. For Oceaneering International, the model starts with last twelve month Free Cash Flow of about $111 million, then uses analyst forecasts for the next few years and extends them using a two stage Free Cash Flow to Equity approach.
Under this framework, Oceaneering's Free Cash Flow is projected to rise to roughly $311 million by 2035, with interim milestones such as $146 million in 2026 and $232 million in 2029, all in $. Simply Wall St discounts each of these future cash flows back to today using a required return that reflects risk in the Energy Services industry, and then sums them to arrive at a per share intrinsic value.
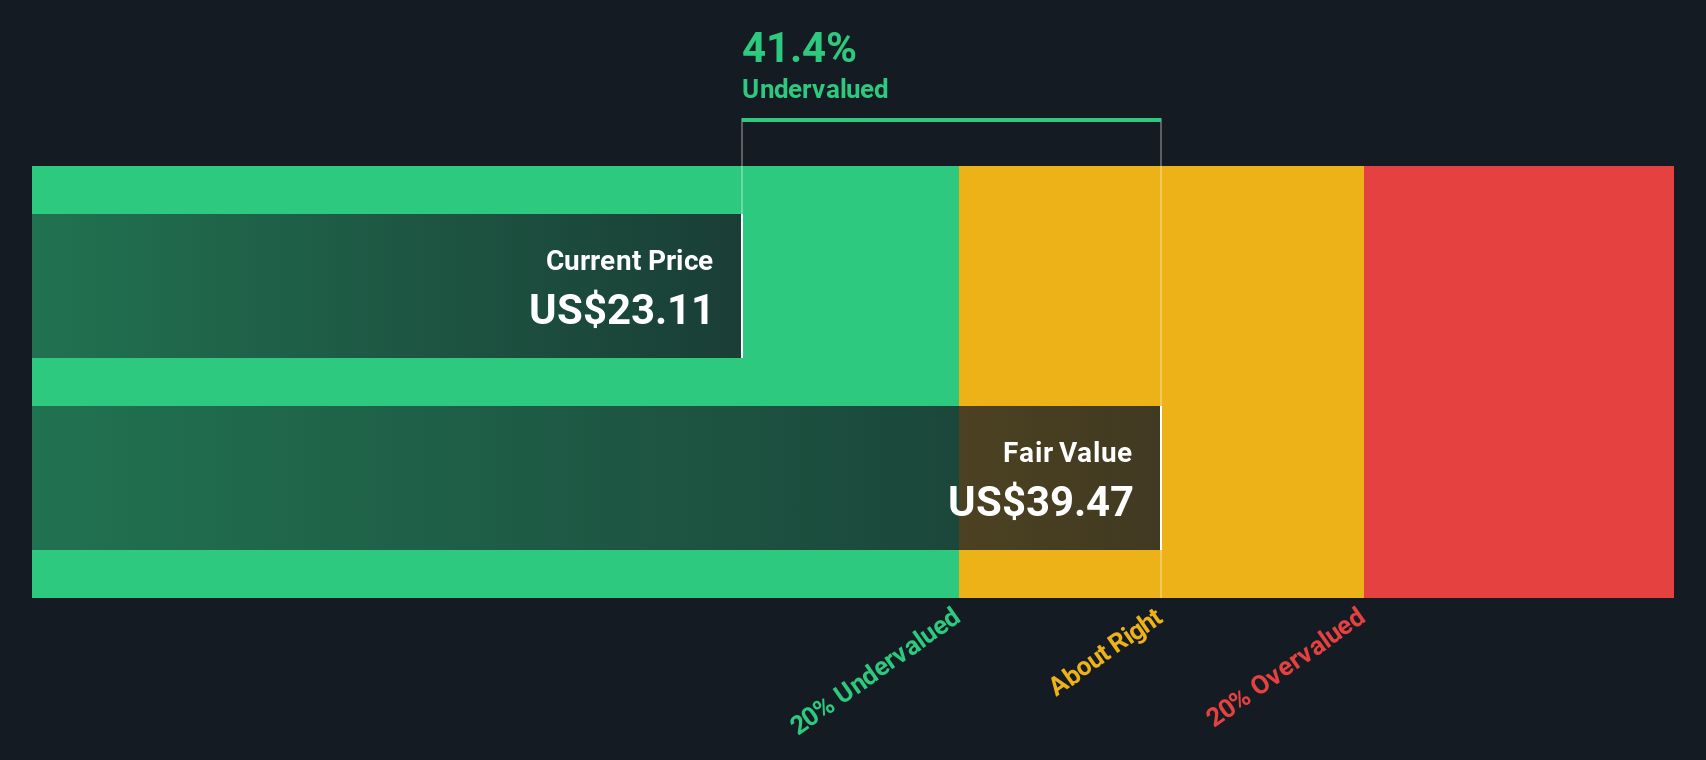
This DCF points to a fair value of about $51.53 per share, implying the stock is trading at roughly a 47.7% discount to its estimated worth at the current price near $26.94. That indicates a meaningful margin of safety for long term investors.
Result: UNDERVALUED
Our Discounted Cash Flow (DCF) analysis suggests Oceaneering International is undervalued by 47.7%. Track this in your watchlist or portfolio, or discover 905 more undervalued stocks based on cash flows.
Approach 2: Oceaneering International Price vs Earnings
For a profitable company like Oceaneering International, the price to earnings ratio is a useful way to gauge value because it directly compares what investors pay for each dollar of current earnings. In general, faster growing and lower risk businesses deserve a higher PE, while slower growing or more volatile companies typically warrant a lower PE.
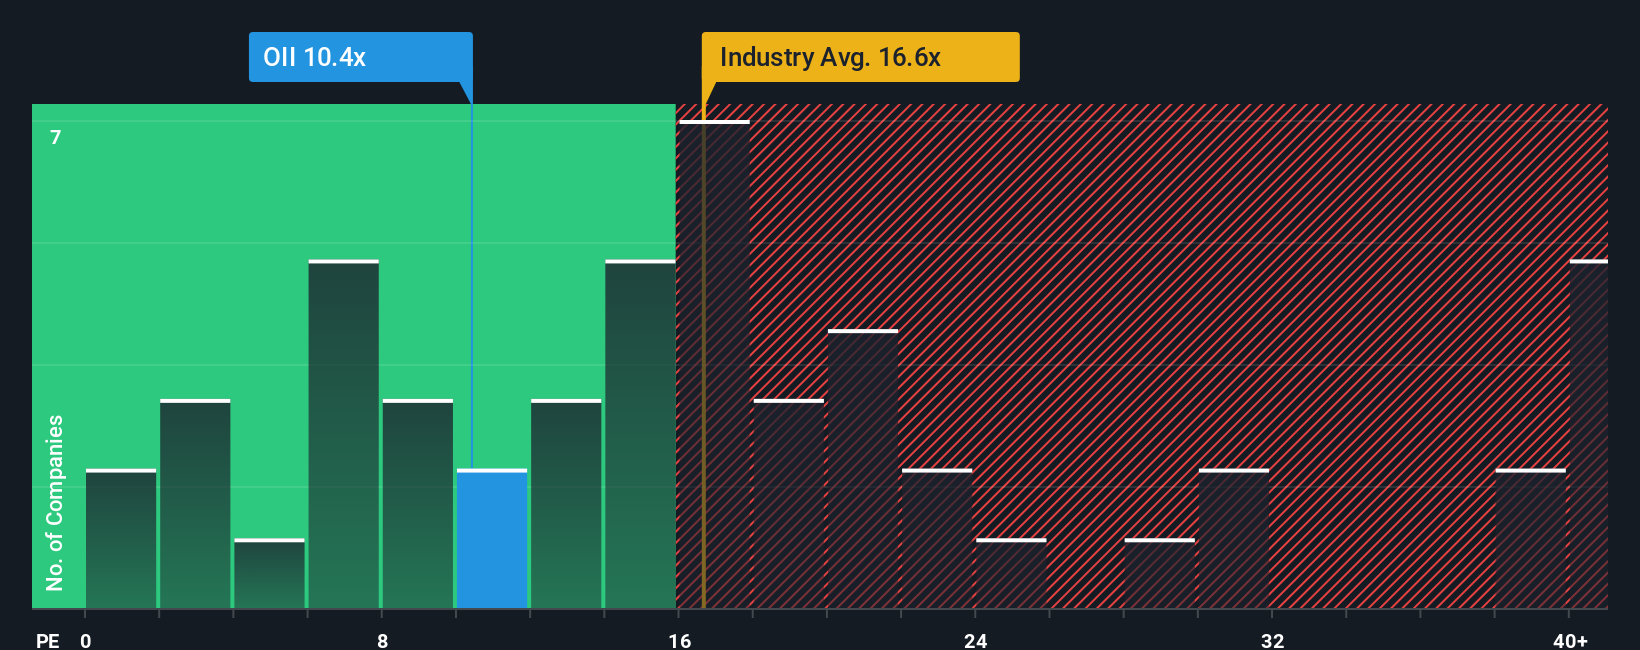
Oceaneering currently trades on about 11.6x earnings, which is well below both the Energy Services industry average of roughly 18.0x and the broader peer group average of about 37.1x. That sizeable discount suggests the market is either skeptical about the durability of current earnings or still assigning a hefty risk premium to the business.
Simply Wall St addresses this by using a Fair Ratio, its proprietary estimate of the PE multiple a company should trade on given its earnings growth outlook, profitability, industry, size, and specific risks. This is more informative than a simple peer or industry comparison because it adjusts for company specific fundamentals rather than assuming all Energy Services names deserve the same multiple. On this framework, Oceaneering's current 11.6x PE sits below its implied Fair Ratio, which points to the shares still being undervalued on an earnings basis.
Result: UNDERVALUED
PE ratios tell one story, but what if the real opportunity lies elsewhere? Discover 1440 companies where insiders are betting big on explosive growth.
Upgrade Your Decision Making: Choose your Oceaneering International Narrative
Earlier we mentioned that there is an even better way to understand valuation, so let us introduce you to Narratives, a simple framework on Simply Wall St's Community page that lets you write the story behind your numbers by linking your view of a company to explicit forecasts for revenue, earnings, margins and ultimately a fair value estimate.
Instead of just accepting a DCF output or a PE multiple, a Narrative helps you spell out why you think Oceaneering will win or struggle in subsea services, defense and renewables. It then automatically turns those assumptions into a financial forecast and a fair value that you can compare with the live share price to inform your own view on whether the stock looks attractive or not.
Because Narratives on Simply Wall St are used by millions of investors and update dynamically when new earnings, news or guidance arrive, you can easily see how different perspectives map to different fair values. For example, one investor might lean toward a cautious view close to the bearish 17.50 dollar target, while another, more optimistic about defense and robotics growth, might anchor around the more upbeat 25.00 dollar target and update their decisions as fresh information comes in.
Do you think there's more to the story for Oceaneering International? Head over to our Community to see what others are saying!
This article by Simply Wall St is general in nature. We provide commentary based on historical data and analyst forecasts only using an unbiased methodology and our articles are not intended to be financial advice. It does not constitute a recommendation to buy or sell any stock, and does not take account of your objectives, or your financial situation. We aim to bring you long-term focused analysis driven by fundamental data. Note that our analysis may not factor in the latest price-sensitive company announcements or qualitative material. Simply Wall St has no position in any stocks mentioned.
Have feedback on this article? Concerned about the content? Get in touch with us directly. Alternatively, email editorial-team@simplywallst.com