
 Nasdaq
 華爾街日報
華爾街日報Is Starbucks Stock Attractive at $85 After Recent Store Innovation Push?
- Wondering if Starbucks at around $85 a share is a bargain or a value trap? You are not alone, and this article is written exactly for investors asking that question.
- Despite a solid 6.8% gain over the last month, the stock is still down 7.8% year to date and about 12.1% over the past year, which hints that the market is still wrestling with what Starbucks is really worth.
- Recent headlines have focused on Starbucks pushing ahead with store format innovation, including smaller, drive through heavy locations, and leaning harder into its loyalty ecosystem and mobile ordering. At the same time, investors continue to weigh macro headwinds like slower discretionary spending and rising labor costs, which helps explain the choppy share price performance.
- On our framework Starbucks scores just 0/6 on valuation checks, suggesting the market may be paying up relative to traditional metrics. However, that is only part of the story. Next we will dig into different valuation approaches and, by the end, explore a more complete way to judge whether the current price really makes sense.
Starbucks scores just 0/6 on our valuation checks. See what other red flags we found in the full valuation breakdown.
Approach 1: Starbucks Discounted Cash Flow (DCF) Analysis
A Discounted Cash Flow, or DCF, model estimates what a company is worth by projecting its future cash flows and then discounting them back to today using a required rate of return. For Starbucks, the model starts with last twelve month Free Cash Flow of about $2.2 billion and builds forward from there.
Analysts expect Starbucks to grow Free Cash Flow to roughly $3.4 billion by 2026 and $3.6 billion by 2028, all in $. Beyond that, Simply Wall St extrapolates cash flows further out, reaching around $4.1 billion by 2035 as growth gradually slows, consistent with a mature global brand rather than a hyper growth story.
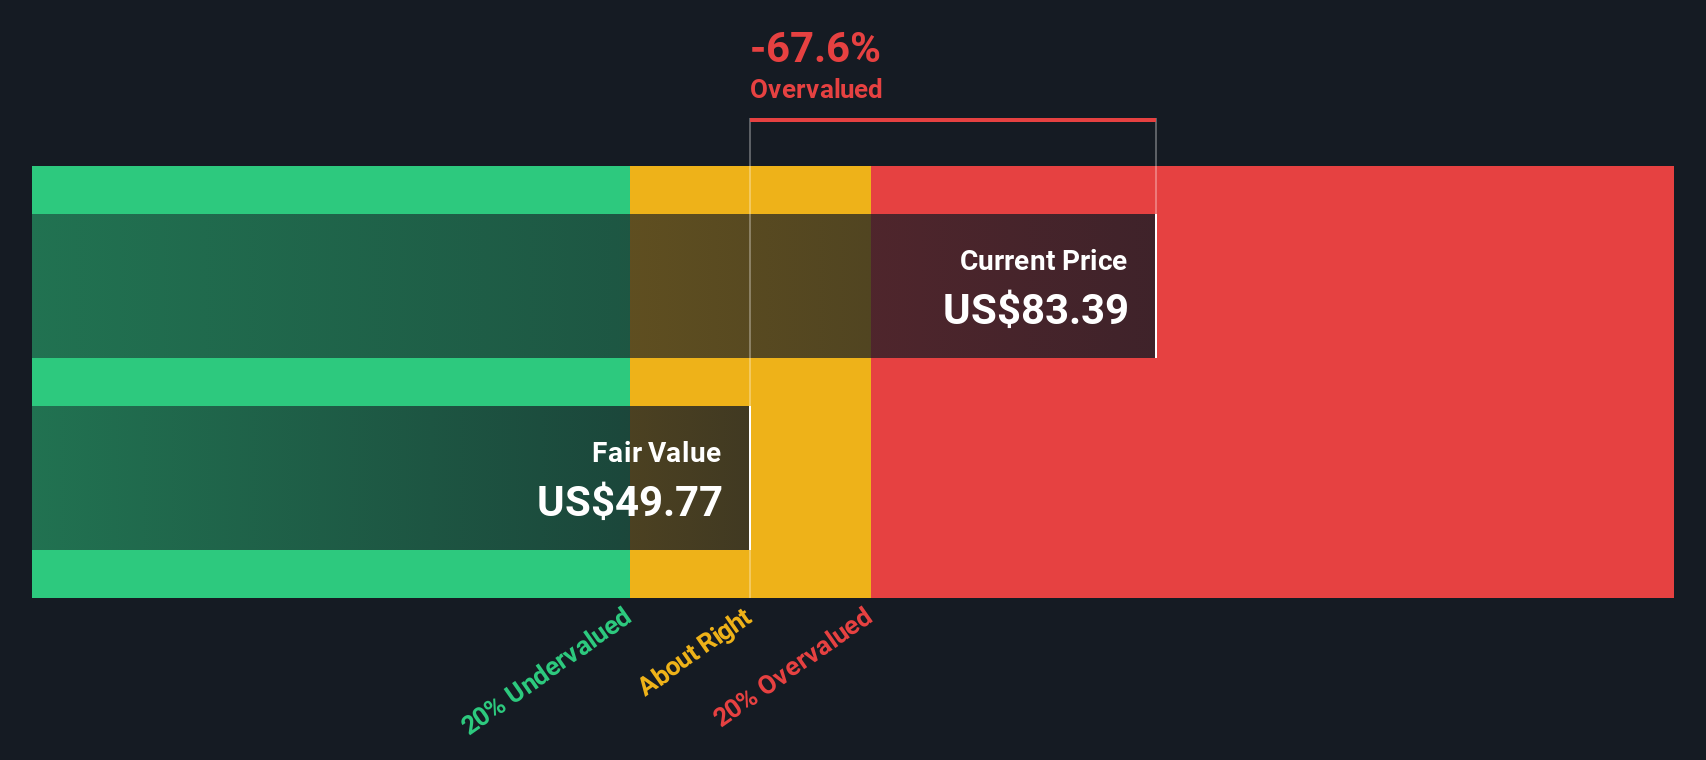
When all those projected cash flows are discounted back under a 2 Stage Free Cash Flow to Equity framework, the estimated intrinsic value comes out at about $48.80 per share. With the stock recently trading near $85, the DCF implies Starbucks is roughly 74.2% overvalued on this basis.
Result: OVERVALUED
Our Discounted Cash Flow (DCF) analysis suggests Starbucks may be overvalued by 74.2%. Discover 907 undervalued stocks or create your own screener to find better value opportunities.
Approach 2: Starbucks Price vs Earnings
For profitable, relatively mature companies like Starbucks, the Price to Earnings, or PE, ratio is a useful yardstick because it ties the share price directly to the profits that ultimately support long term returns. In broad terms, stronger and more reliable earnings growth, and lower perceived risk, justify a higher PE, while slower growth or elevated risk usually call for a lower, more conservative multiple.
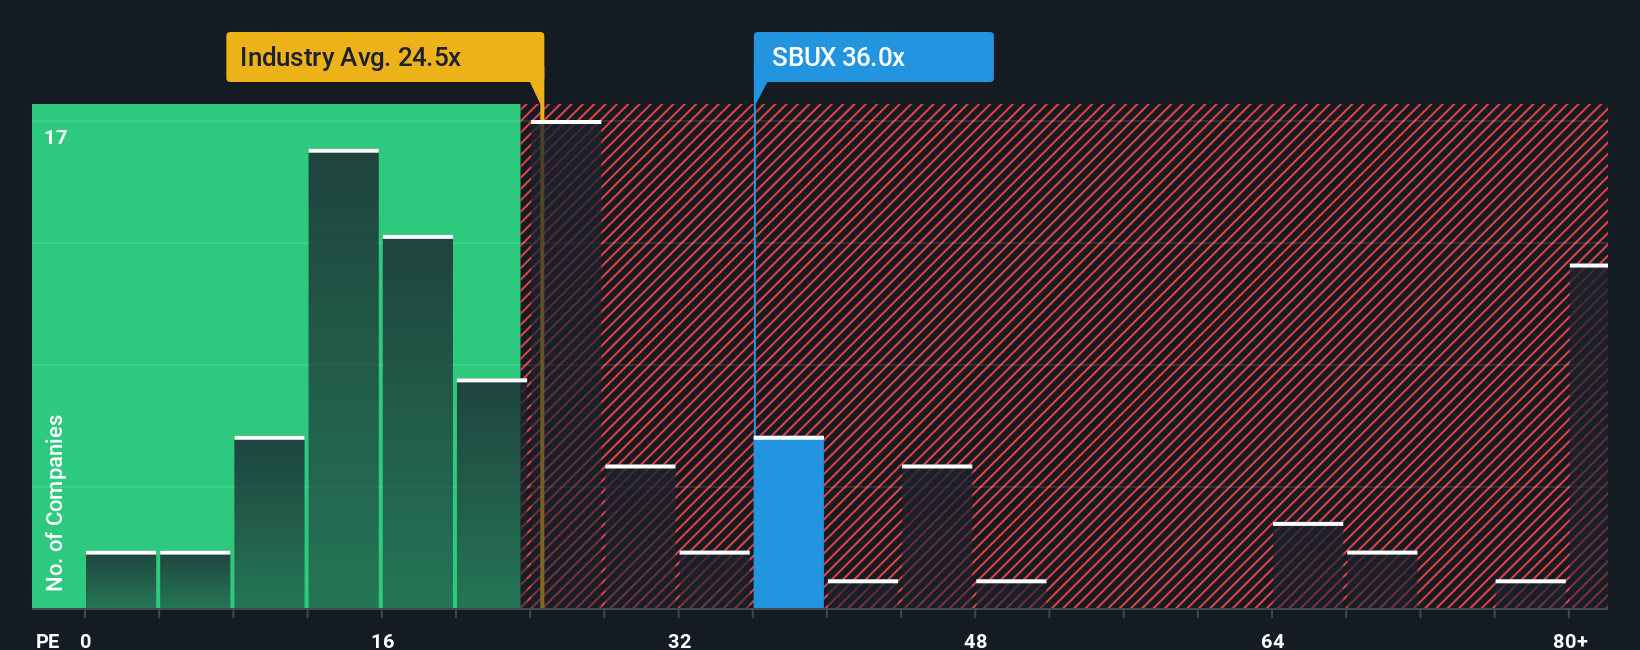
Starbucks currently trades on a PE of about 52.1x, which is meaningfully higher than both the Hospitality industry average of roughly 21.2x and the peer group average of about 48.5x. To go a step further, Simply Wall St also calculates a proprietary Fair Ratio of around 35.3x. This is the PE that might be expected for Starbucks given its specific mix of earnings growth, margins, size, industry positioning and risk profile. This Fair Ratio is more tailored than a simple comparison to peers or the sector because it explicitly incorporates Starbucks own fundamentals rather than assuming all companies should trade on the same multiple. Comparing the current 52.1x PE to the 35.3x Fair Ratio suggests the stock is trading at a premium that looks difficult to justify on these characteristics alone.
Result: OVERVALUED
PE ratios tell one story, but what if the real opportunity lies elsewhere? Discover 1443 companies where insiders are betting big on explosive growth.
Upgrade Your Decision Making: Choose your Starbucks Narrative
Earlier we mentioned that there is an even better way to understand valuation, so let us introduce you to Narratives, a simple tool that lets you connect your view of a company’s story to the numbers behind its future and the fair value you think is reasonable.
A Narrative on Simply Wall St is your story for a stock, where you explain what you think will drive revenue, earnings and margins over time, and the platform automatically converts that perspective into a financial forecast and a fair value estimate.
Because Narratives live on the Community page used by millions of investors, they are easy to access, compare and update, and they help you make decisions by clearly showing how your Fair Value stacks up against today’s share price so you can decide whether Starbucks looks like a buy, a hold or a sell.
As new information like earnings results, commodity price moves or labor headlines emerges, Narratives can be refreshed so that your forecast and Fair Value move with the story instead of lagging it.
For example, one Starbucks Narrative on the platform might assume a fair value near $73 while another points closer to $115, reflecting very different views on how successfully the turnaround will offset cost and competitive pressures.
Do you think there's more to the story for Starbucks? Head over to our Community to see what others are saying!

This article by Simply Wall St is general in nature. We provide commentary based on historical data and analyst forecasts only using an unbiased methodology and our articles are not intended to be financial advice. It does not constitute a recommendation to buy or sell any stock, and does not take account of your objectives, or your financial situation. We aim to bring you long-term focused analysis driven by fundamental data. Note that our analysis may not factor in the latest price-sensitive company announcements or qualitative material. Simply Wall St has no position in any stocks mentioned.
Have feedback on this article? Concerned about the content? Get in touch with us directly. Alternatively, email editorial-team@simplywallst.com