
 Nasdaq
 華爾街日報
華爾街日報Has Barrick Gold’s 156.2% Rally in 2025 Already Priced In Its Fundamentals?
- If you are wondering whether Barrick Mining is still worth considering after its massive run, or if you have already missed the upside, this breakdown will help you cut through the noise and focus on what the numbers say about value.
- The stock has pulled back slightly in the last week with a -0.2% move, but that comes after a powerful 29.2% climb over 30 days and eye catching gains of 156.2% year to date and 146.5% over the past year that have completely changed how the market is pricing its prospects.
- Much of this rerating has been driven by a sharp rebound in gold prices, renewed interest in large scale miners as potential inflation hedges, and headlines around supply constraints that support higher long term commodity prices. At the same time, investors are paying closer attention to capital discipline, environmental commitments, and geopolitical exposure across Barrick Mining's portfolio of assets, all of which feed directly into how sustainable these gains might be.
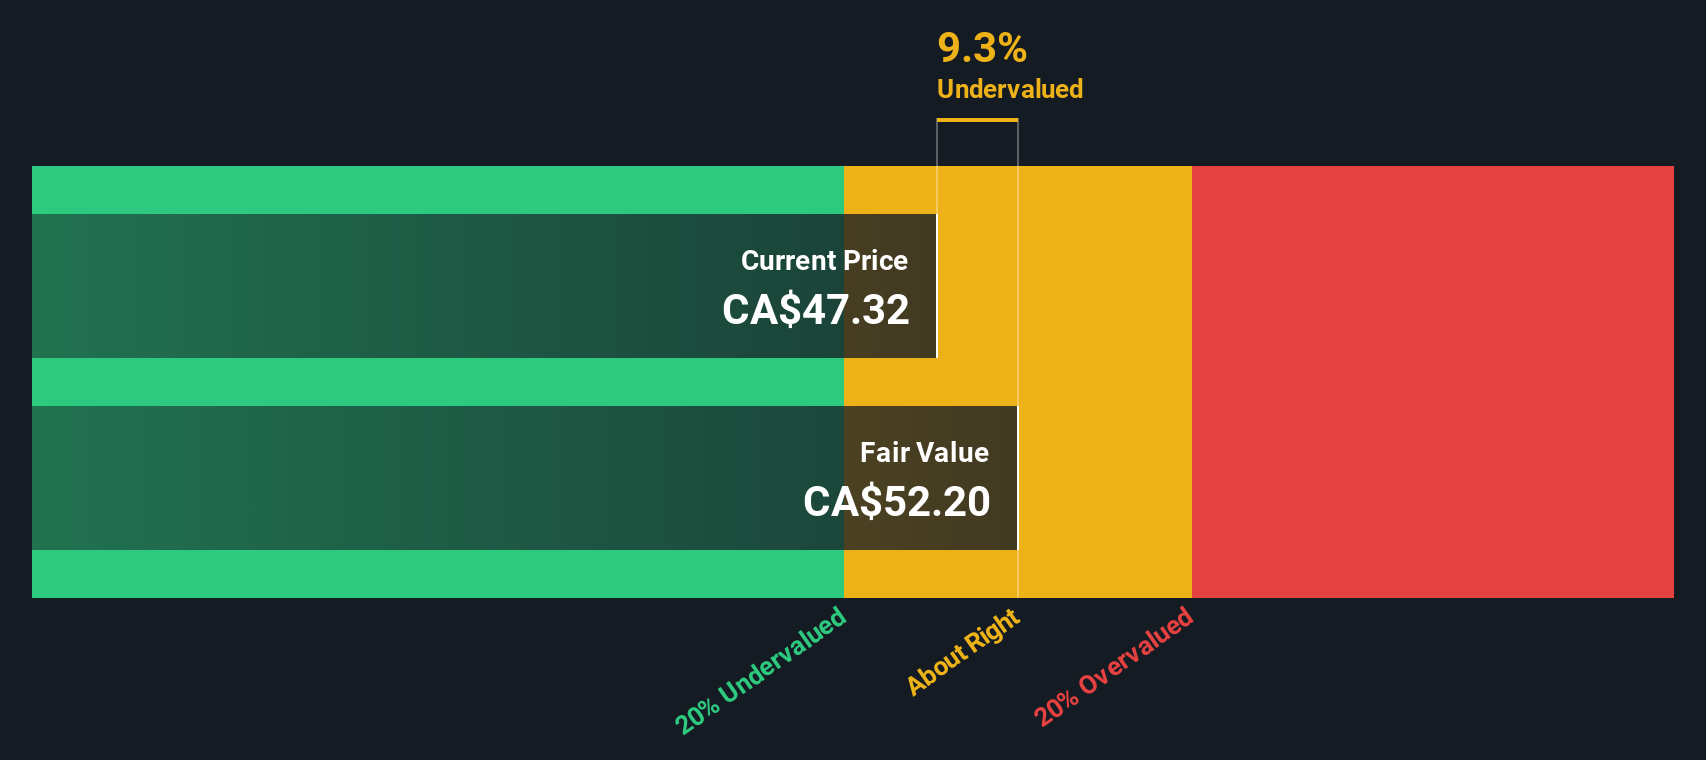
- Despite the big move in the share price, Barrick Mining still scores a solid 5/6 valuation check, suggesting that by several measures it still screens as undervalued. Next, we will walk through what those different valuation approaches are really telling us, and then finish with a more powerful way to think about fair value that goes beyond any single model.
Approach 1: Barrick Mining Discounted Cash Flow (DCF) Analysis
A Discounted Cash Flow model estimates what a company is worth by projecting the cash it can generate in the future and then discounting those cash flows back to today in dollar terms.
For Barrick Mining, the latest twelve month free cash flow is about $2.6 billion. Analysts and internal estimates see this rising steadily, with projections reaching roughly $15.2 billion in free cash flow by 2035, based on a two stage Free Cash Flow to Equity approach that blends near term analyst forecasts with longer term growth assumptions from Simply Wall St.
When all of those future cash flows are discounted back, the model arrives at an intrinsic value of around $135.92 per share. Compared with the current share price, this implies the stock is trading at a 69.9% discount to its estimated fair value, suggesting the recent rally has not fully closed the gap between price and fundamentals.
Result: UNDERVALUED
Our Discounted Cash Flow (DCF) analysis suggests Barrick Mining is undervalued by 69.9%. Track this in your watchlist or portfolio, or discover 910 more undervalued stocks based on cash flows.
Approach 2: Barrick Mining Price vs Earnings
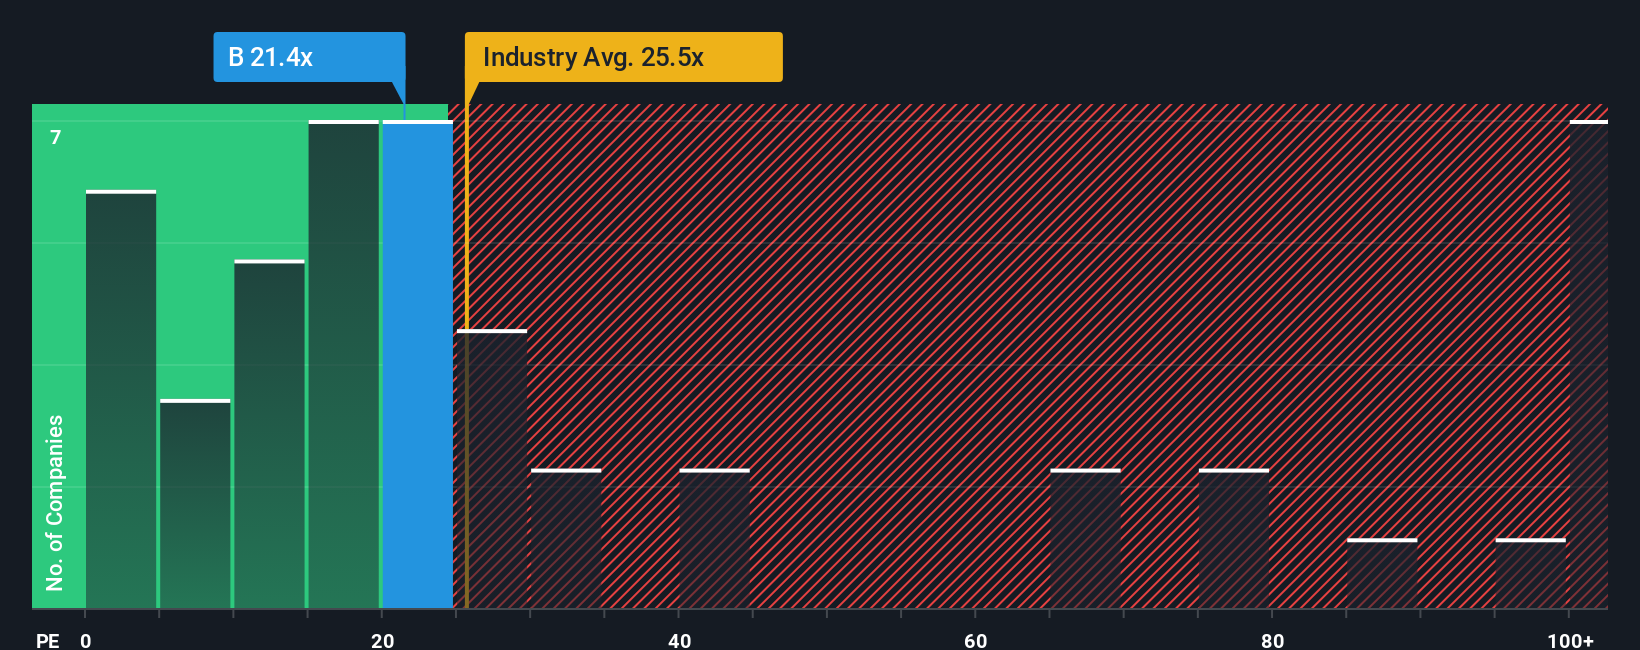
For profitable companies like Barrick Mining, the price to earnings ratio is a straightforward way to connect what investors are paying today with the earnings the business is already generating. In general, higher growth and lower risk justify a higher PE multiple, while slower growth or elevated risks usually mean the stock should trade on a lower, more conservative multiple.
Barrick currently trades on a PE of about 19.3x. That sits below both the Metals and Mining industry average of roughly 22.6x and the broader peer group at around 23.3x, suggesting the market is valuing its earnings more cautiously than many competitors. Simply Wall St’s Fair Ratio for Barrick, at 26.3x, goes a step further. This proprietary metric estimates the PE you might reasonably expect after weighing up the company’s earnings growth outlook, profitability, risk profile, industry, and market cap, rather than just comparing it with a rough industry or peer average.
Because the Fair Ratio of 26.3x is meaningfully above the current 19.3x, this framework points to Barrick Mining still trading at a discount to where its earnings multiple could settle if it delivers on expectations.
Result: UNDERVALUED
PE ratios tell one story, but what if the real opportunity lies elsewhere? Discover 1442 companies where insiders are betting big on explosive growth.
Upgrade Your Decision Making: Choose your Barrick Mining Narrative
Earlier we mentioned that there is an even better way to understand valuation, and on Simply Wall St this comes to life through Narratives, where you connect your view of Barrick Mining’s future with concrete numbers like revenue, earnings and margins. These then flow into a financial forecast and a fair value estimate that you can easily compare to the current share price to decide whether it looks like a buy, hold, or sell.
Within the Community page, Narratives are a simple, accessible tool used by millions of investors to turn a company’s story, such as confidence in stable US assets and a long commodity super cycle, or concern about geopolitical and environmental risks, into specific assumptions about growth, profitability, and discount rates. These assumptions automatically update when new data, news, or earnings arrive, so your fair value view stays fresh rather than static.
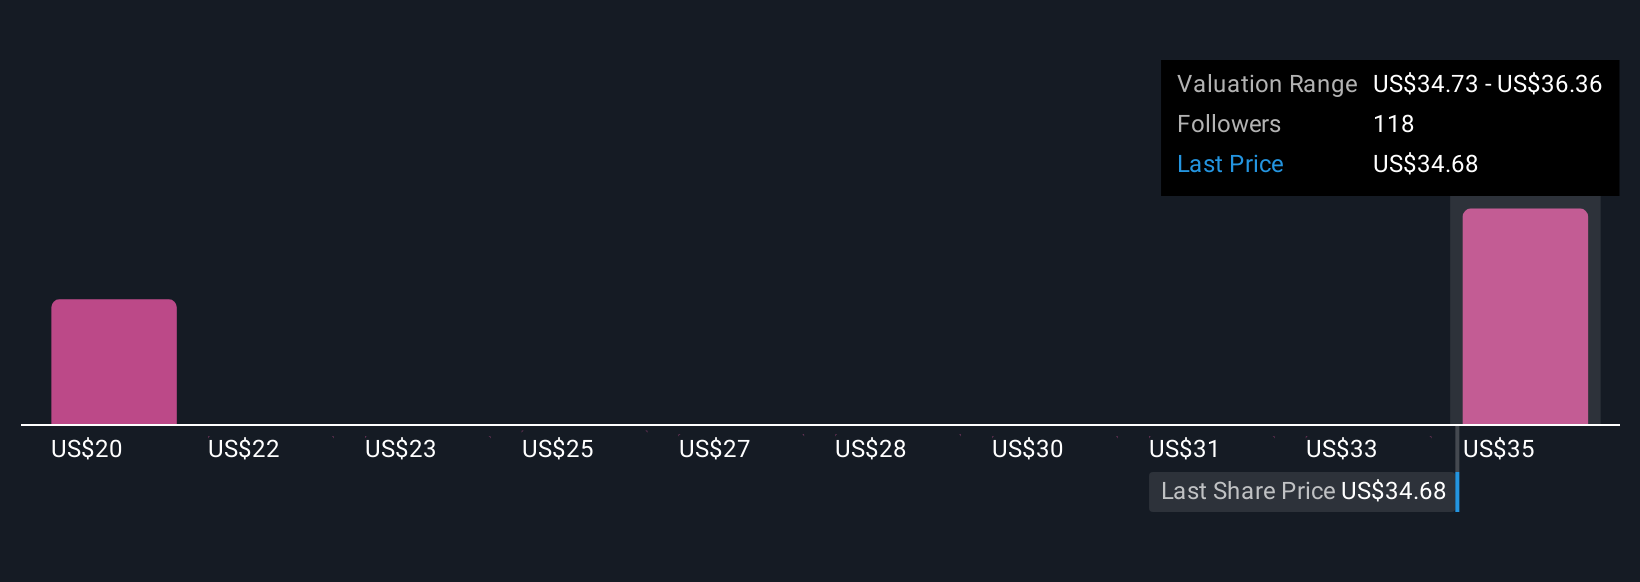
For Barrick Mining, one investor might build a bullish Narrative with higher long term gold prices, improving margins, and steady buybacks that supports a fair value near the upper community range of $20.44 per share. Another investor could take a more cautious stance with slower growth and higher risk, producing a meaningfully lower fair value and a very different decision on whether today’s price is attractive or stretched.
Do you think there's more to the story for Barrick Mining? Head over to our Community to see what others are saying!
This article by Simply Wall St is general in nature. We provide commentary based on historical data and analyst forecasts only using an unbiased methodology and our articles are not intended to be financial advice. It does not constitute a recommendation to buy or sell any stock, and does not take account of your objectives, or your financial situation. We aim to bring you long-term focused analysis driven by fundamental data. Note that our analysis may not factor in the latest price-sensitive company announcements or qualitative material. Simply Wall St has no position in any stocks mentioned.
Have feedback on this article? Concerned about the content? Get in touch with us directly. Alternatively, email editorial-team@simplywallst.com