
 Nasdaq
 華爾街日報
華爾街日報Does Olin’s Steep 2024 Share Price Slump Signal a Long Term Opportunity?
- Investors wondering if Olin is a beaten down chemicals stock hiding real value or a value trap in plain sight can look more closely at what the market might be missing.
- The share price has crept up 2.3% over the last week and 5.9% over the last month, but it is still down 36.6% year to date and 47.4% over the past year.
- Recent attention has focused on how Olin is navigating softer demand in key end markets and ongoing cost pressures, as investors weigh whether this cycle is closer to a bottom or a top. At the same time, management’s ongoing footprint rationalization and focus on higher value products has sparked debate about whether the company is reshaping its earnings power.
- Right now Olin scores just 2/6 on our valuation checks, suggesting only a couple of metrics flag it as clearly undervalued. We will walk through those methods next and then finish by looking at a more holistic way to think about what the stock might be worth.
Olin scores just 2/6 on our valuation checks. See what other red flags we found in the full valuation breakdown.
Approach 1: Olin Discounted Cash Flow (DCF) Analysis
A Discounted Cash Flow model estimates what a business is worth by projecting the cash it can return to shareholders in the future and discounting those cash flows back to today’s dollars.
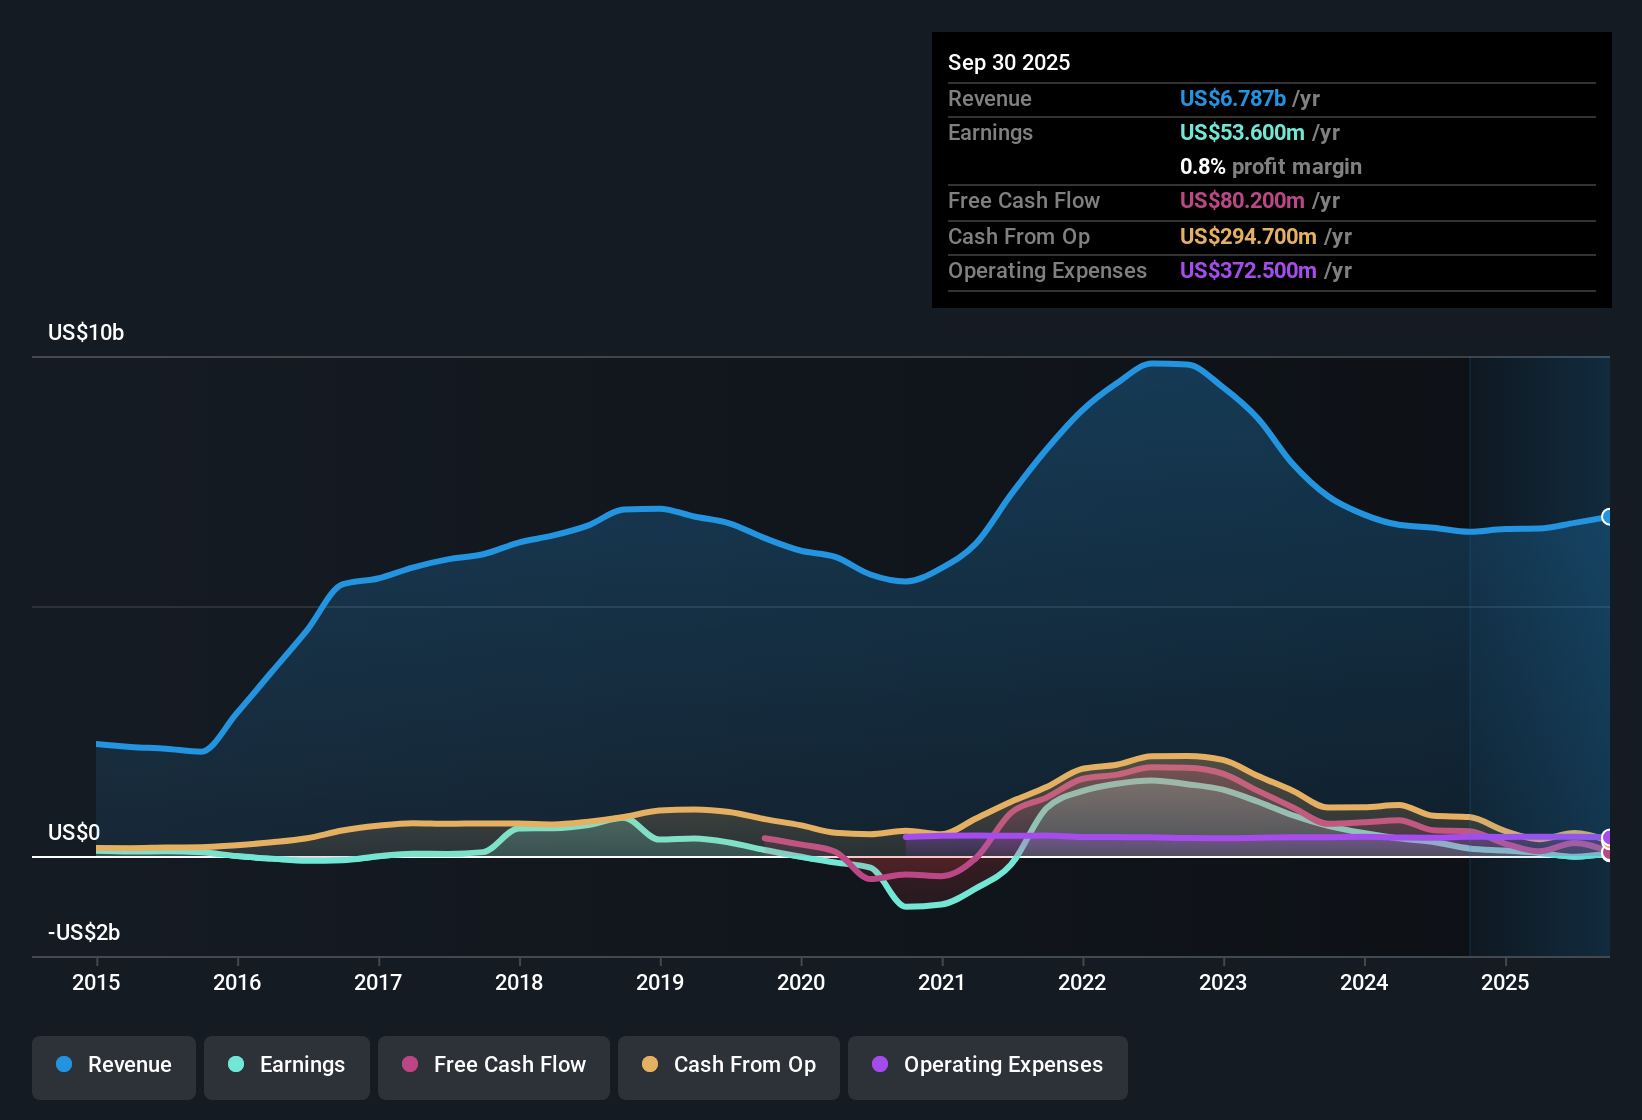
For Olin, the latest twelve month Free Cash Flow is about $21.5 million, but analysts and model assumptions expect this to climb sharply as the cycle improves and footprint changes take hold. Projections, based on a 2 Stage Free Cash Flow to Equity model, see Free Cash Flow rising into the mid hundreds of millions of dollars, reaching roughly $1.27 billion by 2035, with analyst estimates guiding the earlier years and Simply Wall St extrapolations extending the curve.
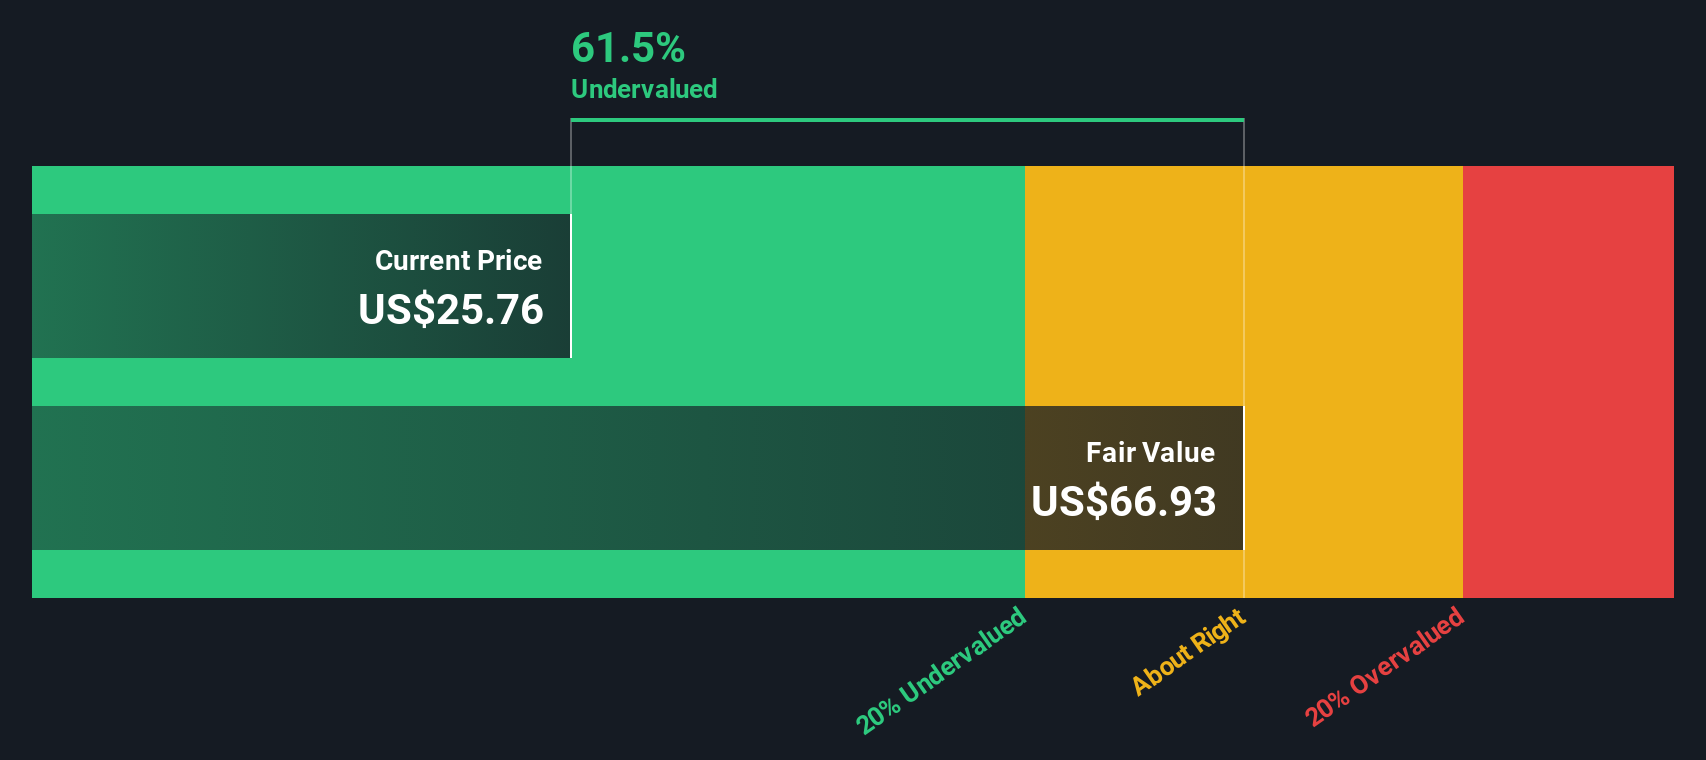
When these projected cash flows are discounted back to today, the DCF model indicates an intrinsic value of about $106.20 per share. Compared with the current share price, that implies the stock is roughly 80.0% undervalued and suggests the market is heavily discounting Olin’s future cash generation potential.
Result: UNDERVALUED
Our Discounted Cash Flow (DCF) analysis suggests Olin is undervalued by 80.0%. Track this in your watchlist or portfolio, or discover 928 more undervalued stocks based on cash flows.
Approach 2: Olin Price vs Earnings
For profitable companies like Olin, the Price to Earnings (PE) ratio is a useful yardstick because it links what investors are paying directly to the profits the business is generating today. In general, faster earnings growth and lower perceived risk justify a higher “normal” PE multiple. Slower growth or higher uncertainty usually cap what investors are willing to pay.
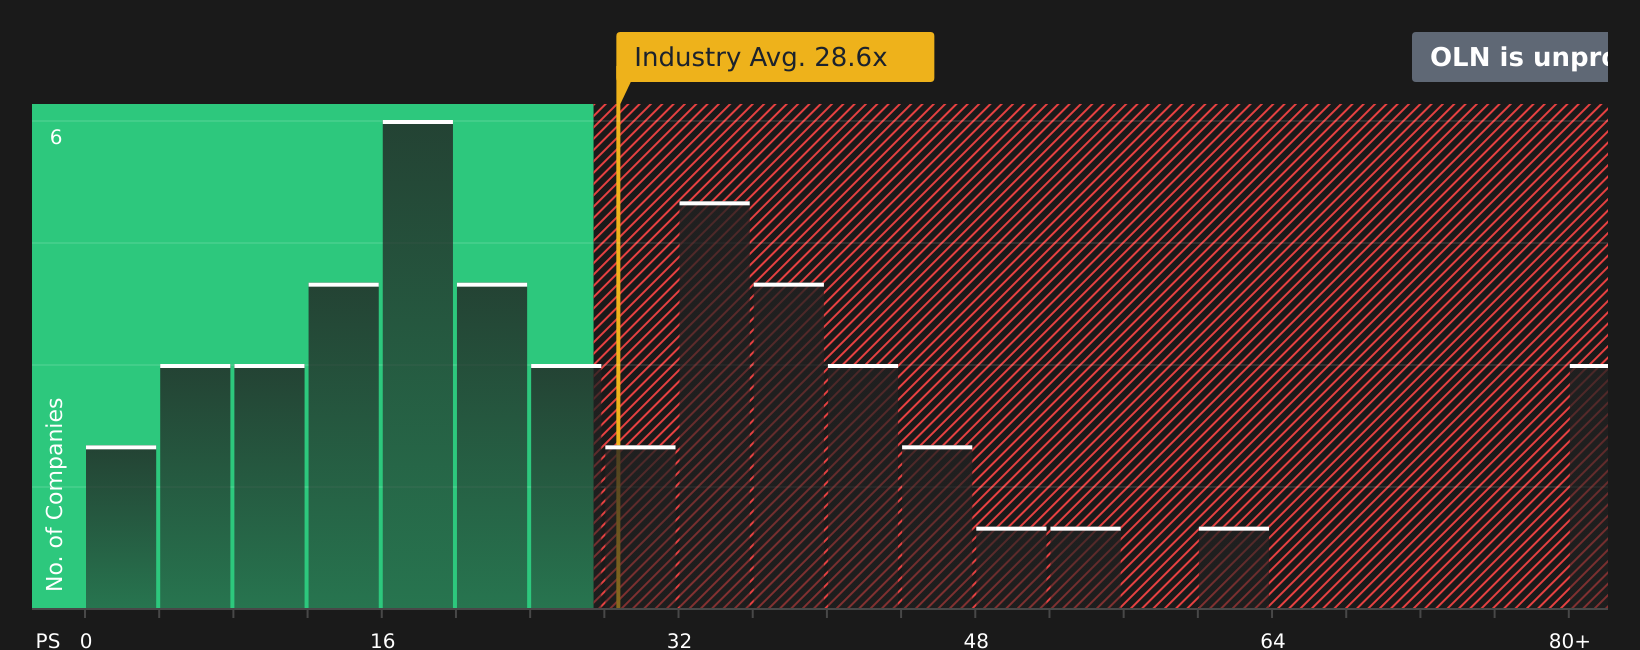
Olin currently trades on a PE of about 45.22x, which is well above both the Chemicals industry average of roughly 22.81x and the broader peer group at about 23.36x. Simply Wall St’s Fair Ratio for Olin, however, is a lower 35.87x. This represents the PE multiple that would be expected given its specific combination of earnings growth prospects, profitability, industry position, market cap and company specific risks.
This Fair Ratio is more informative than a simple comparison with peers or the industry because it adjusts for Olin’s own fundamentals rather than assuming all chemical stocks deserve the same multiple. Since Olin’s current PE of 45.22x sits noticeably above the 35.87x Fair Ratio, the shares look expensive on this metric.
Result: OVERVALUED
PE ratios tell one story, but what if the real opportunity lies elsewhere? Discover 1439 companies where insiders are betting big on explosive growth.
Upgrade Your Decision Making: Choose your Olin Narrative
Earlier we mentioned that there is an even better way to understand valuation, so let us introduce you to Narratives. These are simple stories investors create on Simply Wall St’s Community page to connect their view of a company’s future revenues, earnings and margins to a financial forecast, a fair value estimate, and ultimately a clear buy or sell decision by comparing that fair value to today’s price. Investors can then see that view automatically update as new news or earnings arrive. For example, a bullish investor might build an Olin Narrative around successful cost reductions, resilient caustic soda demand and a fair value closer to the most optimistic analyst target of about $31 per share. A more cautious investor could focus on overcapacity, regulatory and ammunition headwinds and land nearer the $20 bear case. Both perspectives can coexist and remain easy to track and refine over time.
Do you think there's more to the story for Olin? Head over to our Community to see what others are saying!
This article by Simply Wall St is general in nature. We provide commentary based on historical data and analyst forecasts only using an unbiased methodology and our articles are not intended to be financial advice. It does not constitute a recommendation to buy or sell any stock, and does not take account of your objectives, or your financial situation. We aim to bring you long-term focused analysis driven by fundamental data. Note that our analysis may not factor in the latest price-sensitive company announcements or qualitative material. Simply Wall St has no position in any stocks mentioned.
Have feedback on this article? Concerned about the content? Get in touch with us directly. Alternatively, email editorial-team@simplywallst.com