
 Nasdaq
 華爾街日報
華爾街日報Is Duke Energy Still Fairly Priced After Strong Multi Year Share Price Gains?
- Wondering if Duke Energy is still fairly priced after its long run up, or if there is quietly some value left on the table for patient investors?
- The stock trades around $119.69 after slipping 1.8% over the last week and 3.7% over the last month, but it is still up 11.0% year to date and 9.1% over the last year, building on 34.1% and 59.1% gains over the past 3 and 5 years.
- Recent moves have been shaped by ongoing investor interest in defensive, dividend paying utilities and by policy developments that support large scale grid upgrades and cleaner generation. Duke has been in the headlines for its long term decarbonization plans, major transmission investments, and regulatory decisions that influence how quickly it can recover those costs and grow earnings.
- Using our framework, Duke Energy scores a 3 out of 6 on valuation checks. This suggests it looks undervalued on some metrics but not others. In the sections that follow we will walk through those approaches and, at the end, explore an even more useful way to think about what "fair value" really means for this stock.
Find out why Duke Energy's 9.1% return over the last year is lagging behind its peers.
Approach 1: Duke Energy Dividend Discount Model (DDM) Analysis
The Dividend Discount Model estimates what a stock is worth by projecting all future dividends a company will pay, then discounting those payments back to today. It is especially relevant for mature, dividend focused utilities like Duke Energy.
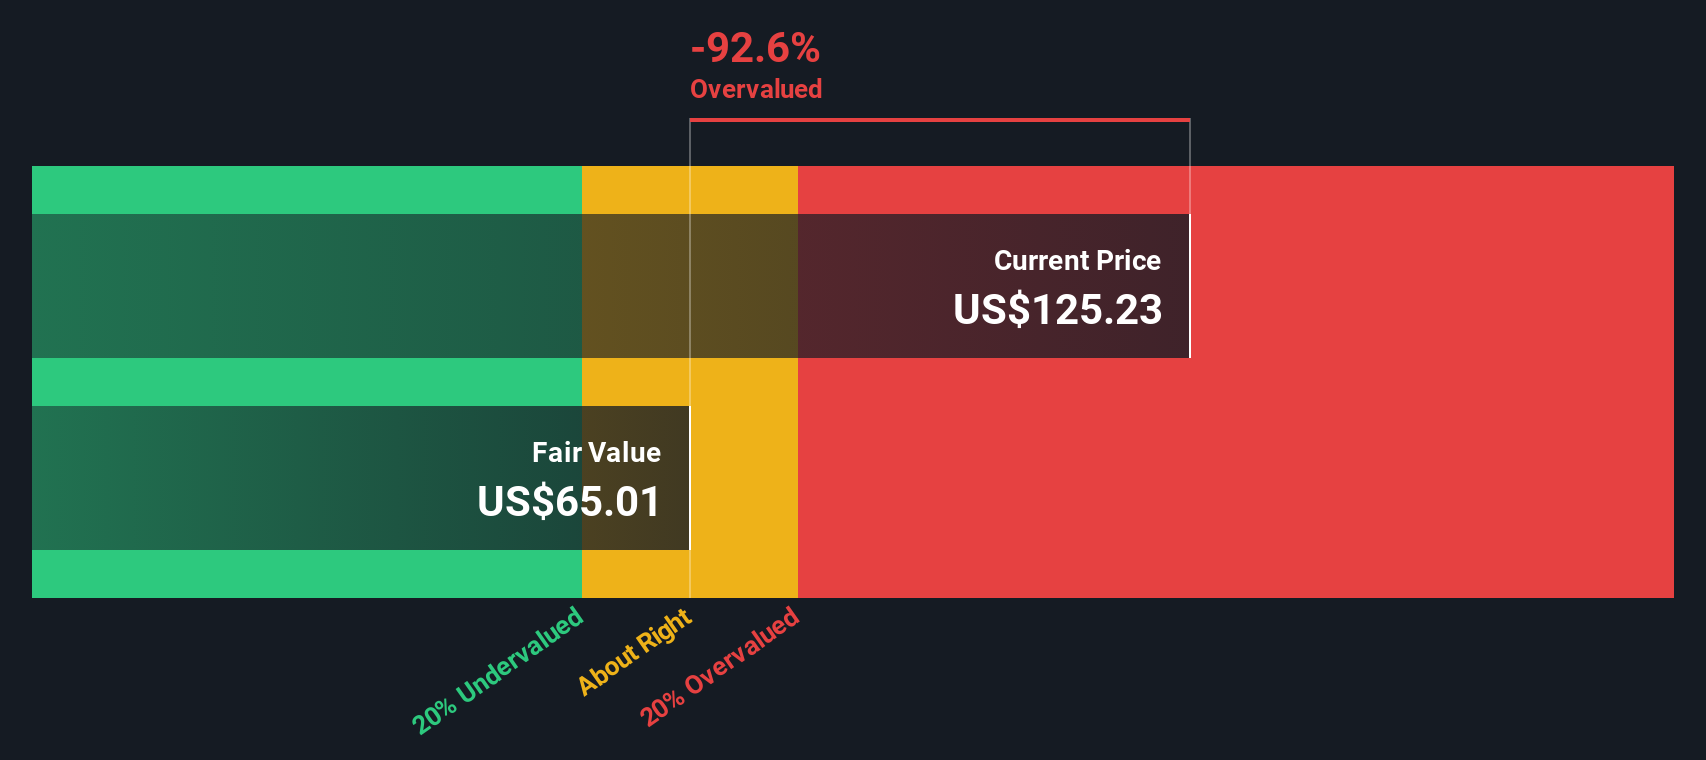
For Duke, the model starts with its current annual dividend per share of about $4.50. Based on a return on equity of roughly 8.8% and a very high payout ratio of about 102%, the implied long term dividend growth rate is slightly negative at around 0.2%. That growth figure comes from the simple relationship between how much profit is retained versus paid out and the return generated on that retained capital.
Feeding these assumptions into the DDM results in an intrinsic value estimate of roughly $63 per share. With the stock trading around $119.69, the model suggests Duke Energy is about 89.5% overvalued on a pure dividend basis. This implies today’s price already reflects much stronger or more durable dividend growth than the model considers reasonable.
Result: OVERVALUED
Our Dividend Discount Model (DDM) analysis suggests Duke Energy may be overvalued by 89.5%. Discover 932 undervalued stocks or create your own screener to find better value opportunities.
Approach 2: Duke Energy Price vs Earnings
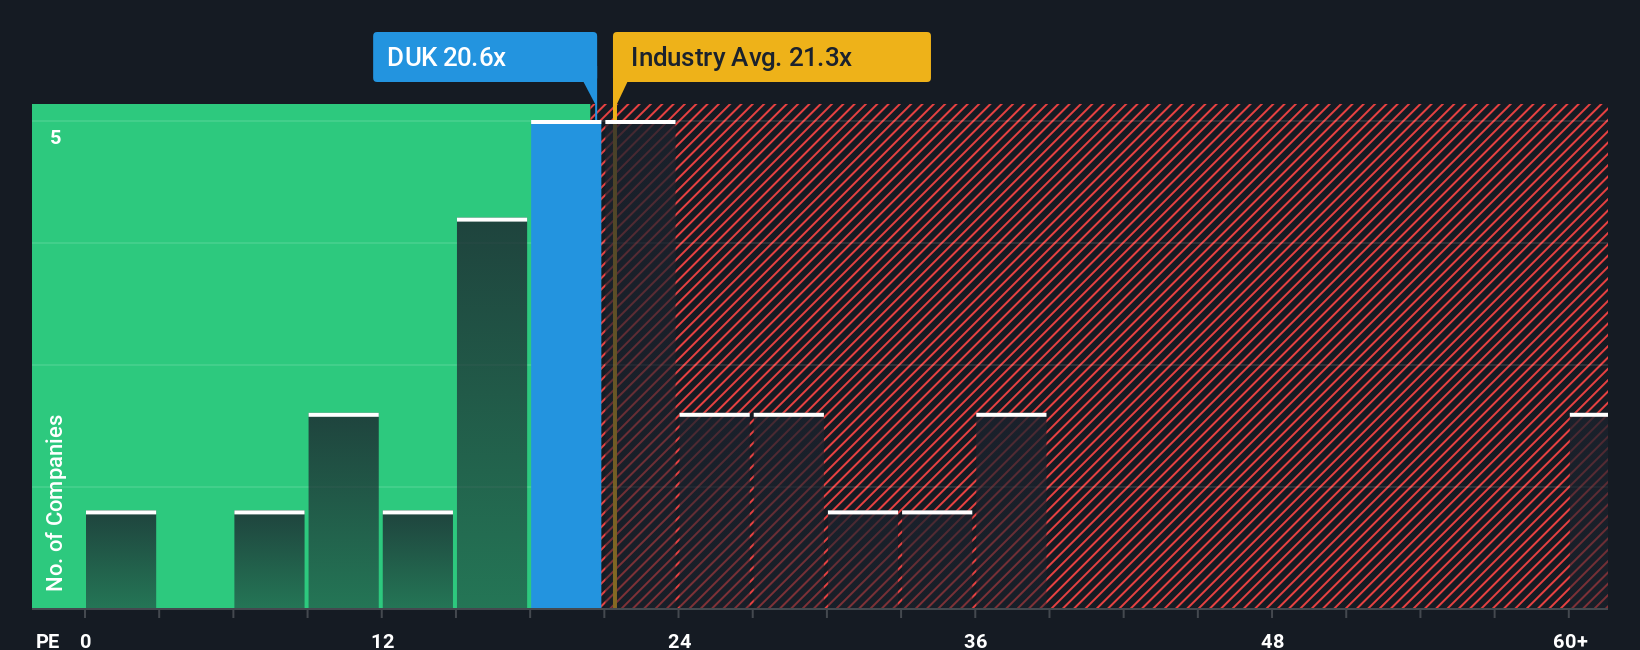
For consistently profitable companies like Duke Energy, the price to earnings, or PE, ratio is often the most intuitive way to judge valuation because it compares what investors pay today with the profits the business is already generating. In general, faster growth and lower perceived risk justify a higher PE, while slower growth and higher risk call for a lower, more conservative multiple.
Duke currently trades on a PE of about 18.9x, which is below both the Electric Utilities industry average of roughly 20.5x and the broader peer group average of around 27.0x. Simply Wall St also calculates a Fair Ratio of 24.2x for Duke Energy, a proprietary estimate of what its PE should be once factors like earnings growth, profitability, industry, company size and risk profile are all considered together.
This Fair Ratio is more informative than a simple comparison with peers or the sector because it adjusts for the specific drivers that matter most for Duke, including its relatively stable earnings base and regulated risk profile. Since the Fair Ratio of 24.2x sits meaningfully above the current 18.9x, the multiple based view indicates the stock may have room to rerate higher.
Result: UNDERVALUED
PE ratios tell one story, but what if the real opportunity lies elsewhere? Discover 1440 companies where insiders are betting big on explosive growth.
Upgrade Your Decision Making: Choose your Duke Energy Narrative
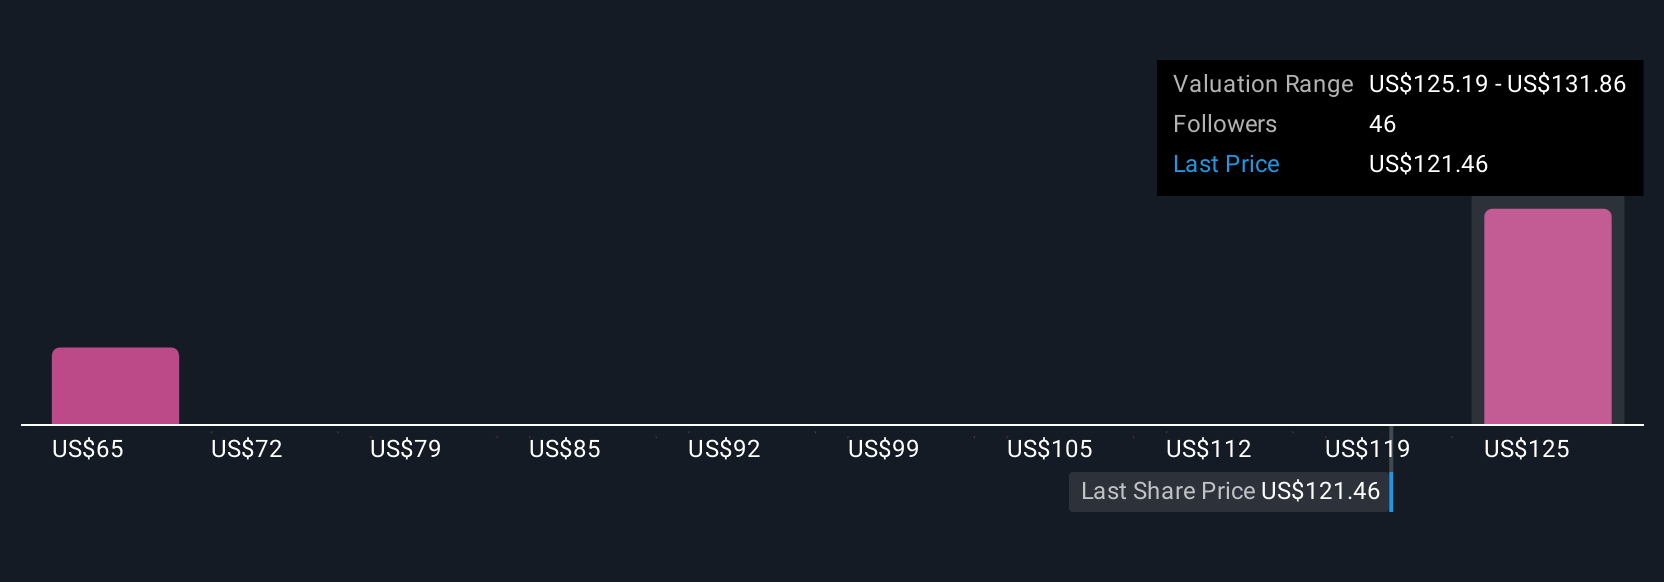
Earlier we mentioned that there is an even better way to understand valuation. Let us introduce you to Narratives, a simple tool on Simply Wall St’s Community page that lets you write the story behind your numbers by linking your view of Duke Energy’s business to a forward looking forecast for revenue, earnings and margins, and then to a Fair Value you can compare with today’s price to help frame your decision. That Fair Value automatically updates as new news or earnings arrive. For example, one investor might create a bullish Duke Narrative that assumes faster Southeast demand growth, higher margins and a Fair Value closer to the upper analyst target of about $137 per share. A more cautious investor might build a conservative Narrative that incorporates regulatory and funding risks, slower growth and a Fair Value near or even below today’s price, illustrating how the same company can support very different but clearly quantified perspectives.
Do you think there's more to the story for Duke Energy? Head over to our Community to see what others are saying!
This article by Simply Wall St is general in nature. We provide commentary based on historical data and analyst forecasts only using an unbiased methodology and our articles are not intended to be financial advice. It does not constitute a recommendation to buy or sell any stock, and does not take account of your objectives, or your financial situation. We aim to bring you long-term focused analysis driven by fundamental data. Note that our analysis may not factor in the latest price-sensitive company announcements or qualitative material. Simply Wall St has no position in any stocks mentioned.
Have feedback on this article? Concerned about the content? Get in touch with us directly. Alternatively, email editorial-team@simplywallst.com