


UBE (TSE:4208), What Is Behind The Fresh Attention?
UBE (TSE:4208) just raised its earnings guidance for both the September 2026 half year and the March 2027 full year, attributing the revision to firmer pricing in its Polymers & Chemicals operations.
That guidance revision comes after a strong run in UBE’s shares this year, with a year to date share price return of 30.88% and a 7 day share price gain of 7.11% lifting the stock to ¥3,361.0. Over a longer horizon, the total shareholder return of 42.65% over one year and 107.97% over five years indicates that investors have rewarded the business. However, the 90 day share price return declined 8.02%, which suggests some of that momentum has cooled recently as the market digests earlier gains and reassesses the balance between pricing power, execution risks and valuation.
Identify whether UBE’s pricing power story lines up with other materials players by scanning the hand picked 72 high quality undiscovered gems that also show solid fundamentals.After a 31% year to date climb and fresh guidance tied to stronger Polymers & Chemicals pricing, UBE now sets a higher bar for returns. Does today’s valuation still leave enough upside to justify the risk?
Preferred P/E of 13.9x: Is it justified?
On simple earnings terms, UBE trades on a P/E of 13.9x, which prices the shares below the peer average of 21.1x yet slightly above the level implied by its own cash flows according to the SWS DCF model.
The P/E multiple compares today’s share price with per share earnings and gives you a quick read on how much investors are paying for each unit of profit. For a diversified materials player like UBE, where earnings can be cyclical and capital intensive, this yardstick is often a shorthand for how much confidence the market has in the durability of current profits.
Relative to other Japanese chemicals stocks, the P/E of 13.9x sits above the industry average of 11.4x. This points to investors paying a premium compared with peers. That premium looks more restrained when set against the estimated fair P/E of 14.1x. This suggests the current multiple is close to the level the market could move towards if sentiment and fundamentals stay aligned.
Explore the SWS fair ratio for UBE.
Result: Price-to-earnings of 13.9x (ABOUT RIGHT)
Still, UBE’s story could be knocked off course if Polymers & Chemicals pricing weakens, or if its capital heavy machinery and materials projects run into execution setbacks.
Find out about the key risks to this UBE narrative.
Another View: What The SWS DCF Model Says About UBE
On the flip side of the P/E story, the SWS DCF model points to a very different picture for UBE. With the shares at ¥3,361 and an estimated future cash flow value of ¥1,035.32, the stock screens as materially overvalued on this method. Which lens do you trust more for a cyclical materials player?
Look into how the SWS DCF model arrives at its fair value.
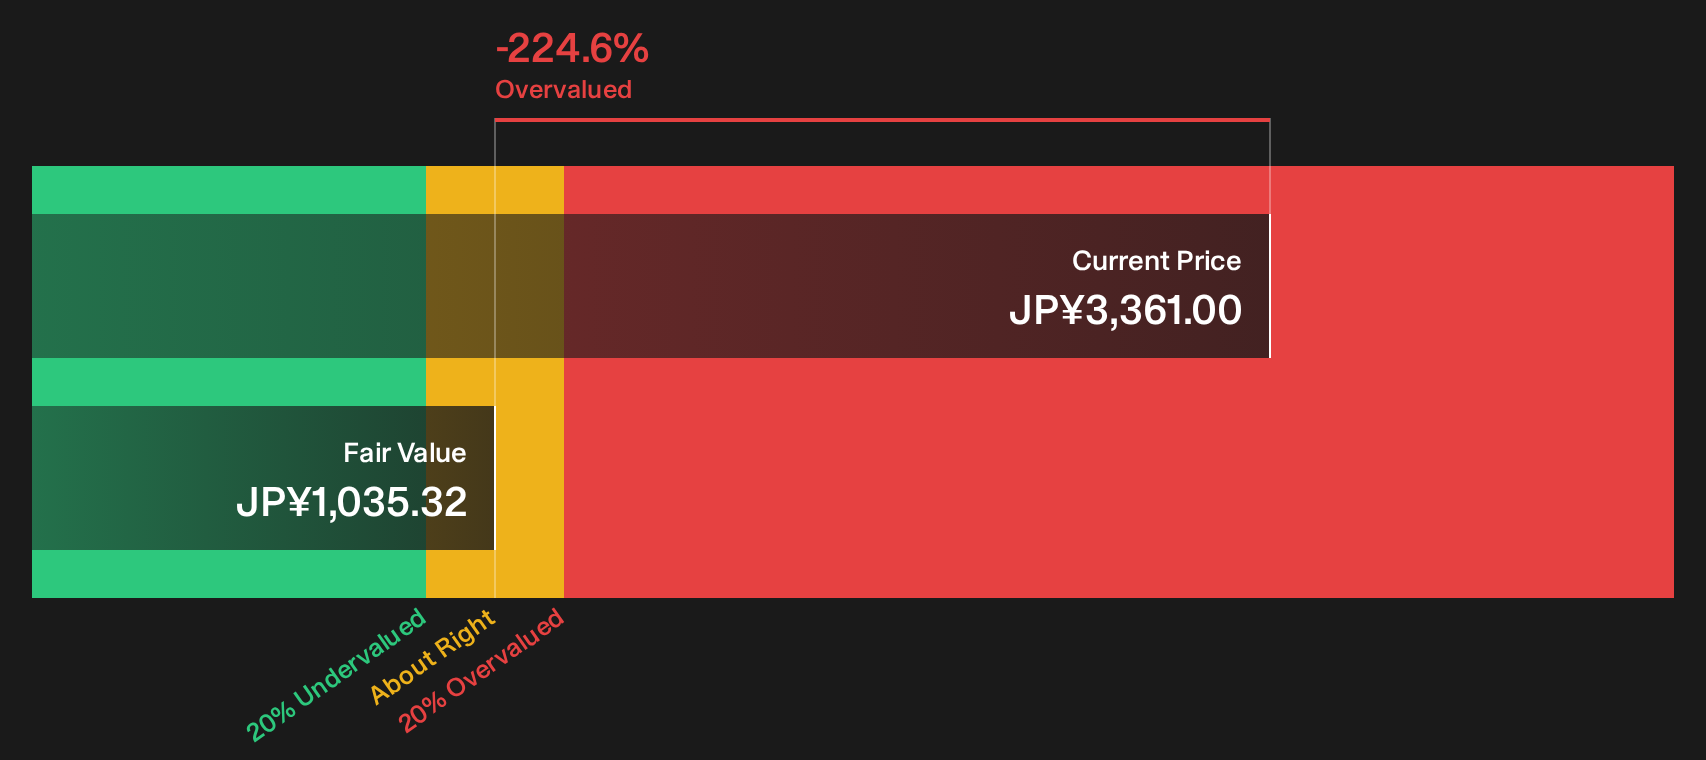
Simply Wall St performs a discounted cash flow (DCF) on every stock in the world every day (check out UBE for example). We show the entire calculation in full. You can track the result in your watchlist or portfolio and be alerted when this changes, or use our stock screener to discover 18 high quality undervalued stocks. If you save a screener we even alert you when new companies match - so you never miss a potential opportunity.
Next Steps
Mixed signals on UBE so far? If the guidance shift has your attention, review the full risk and reward balance before making a call with the 2 key rewards and 2 important warning signs.
Looking for more ideas beyond UBE?
If UBE has sharpened your focus on pricing power and valuation tension, use the screener tools to spot other opportunities before the crowd catches on.
- Target resilient balance sheets by scanning the list of solid balance sheet and fundamentals (24 results) to find companies that combine financial strength with room for the story to evolve.
- Hunt for potential mispricings using the 18 high quality undervalued stocks where quality metrics and market expectations do not always line up.
- Prioritise sleep at night potential through the 19 resilient stocks with low risk scores to help limit unpleasant surprises when conditions get tough.
Have feedback on this article? Concerned about the content? Get in touch with us directly. Alternatively, email editorial-team@simplywallst.com