


TOTO (TSE:5332) Stock Faces An H1 Earnings Sentiment Reset
TOTO entered its H1 2027 earnings release with a restless shareholder base. The share price had slipped around 5.8% over the past month and about 6.9% over three months, even after a small 7 day rebound.
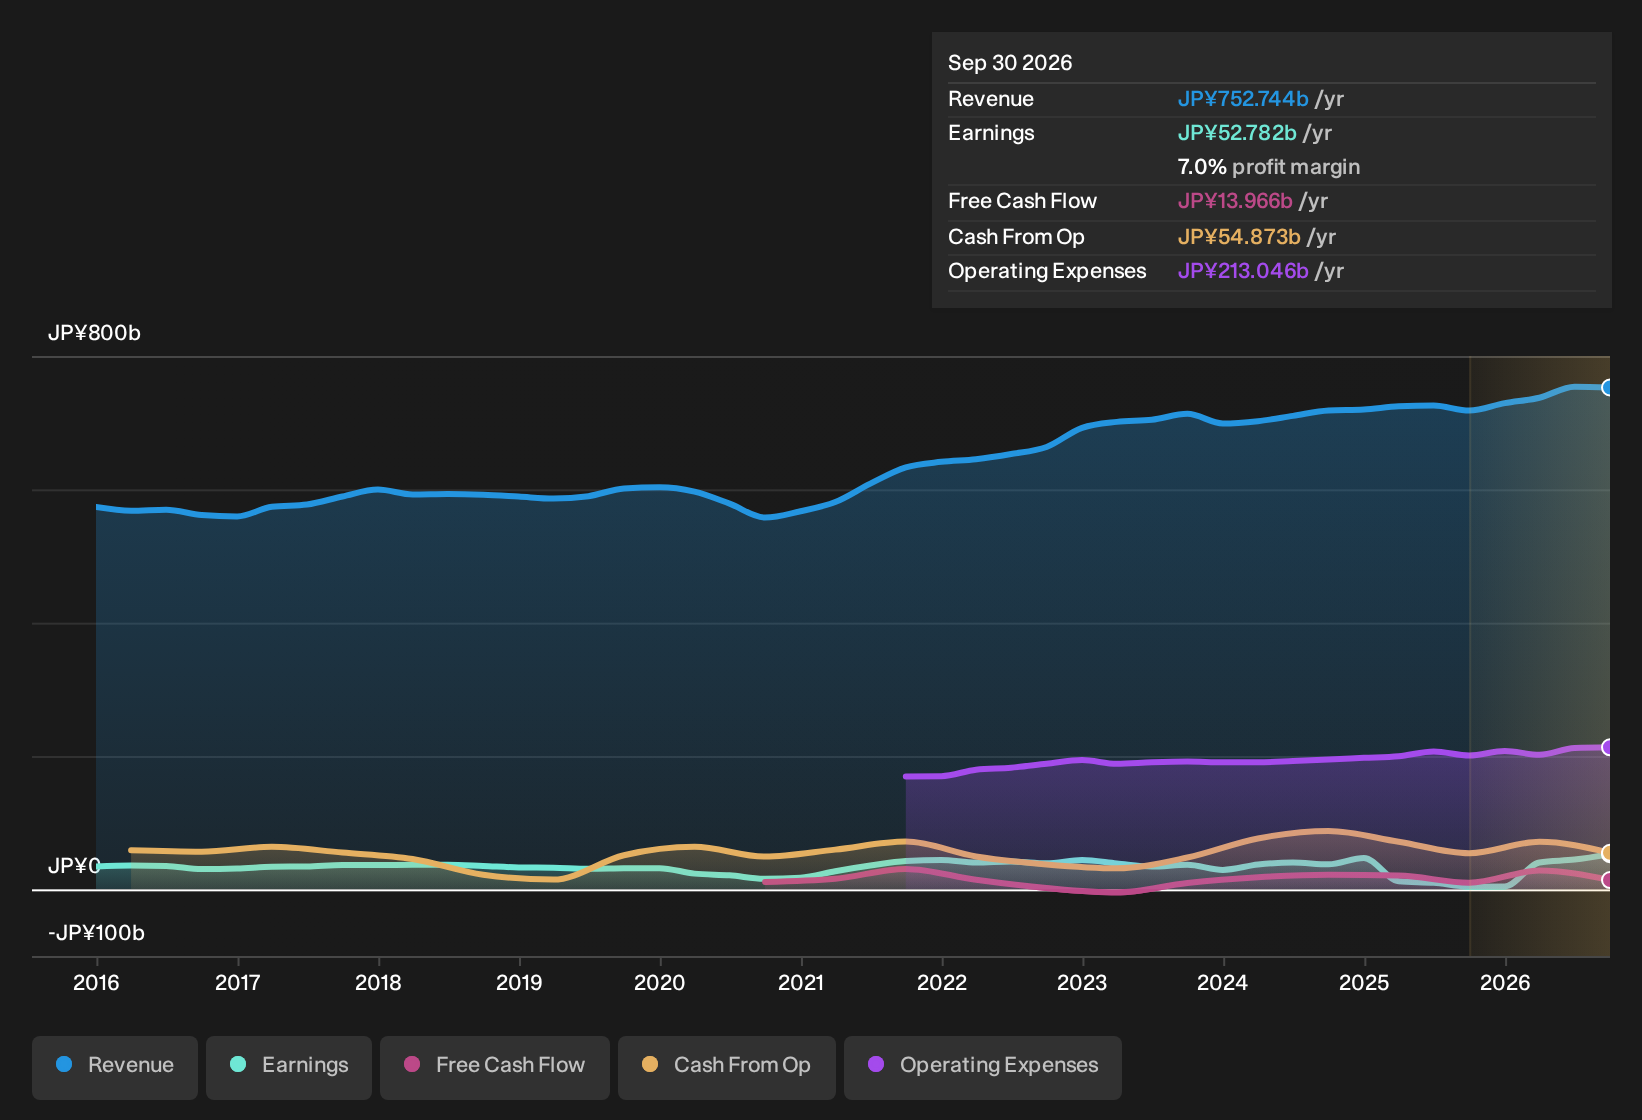
The results just posted tell a different emotional story. Basic earnings per share for the half came in at ¥129.63 and trailing twelve month earnings reached ¥321.01 per share, alongside a net profit margin near 7% over the past year. That level of profit recovery contrasts with a market that still prices the stock on edge, setting up a clear sentiment reckoning between fear and the income statement.
Like the earnings power at TOTO but uneasy about a share price that still feels on edge after recent declines? Compare this setup with our hand picked group of sturdier profit generators in the 24 resilient stocks with low risk scores
H1 2027 Earnings Summary
- Revenue (H1 2027 vs. H1 2026): ¥364,675 million vs. ¥349,372 million (up about 4.4%)
- Net Income (Excl. Extra Items, H1 2027 vs. H1 2026): ¥21,315 million vs. ¥8,790 million (very large increase, more than 2x)
- Basic EPS (H1 2027 vs. H1 2026): ¥129.63 per share vs. ¥52.66 per share (very large increase, more than 2x)
- Net Profit Margin (Trailing 12 Months vs. Previous 12 Months): ~7% vs. ~0.6% (very strong margin improvement)
TOTO’s profit surged over 1,200% in a year. Ask Charlie what makes TOTO’s earnings jump believable.
Profit Recovery Supports Defensive TOTO Thesis
TOTO looks closer to that steady, essential infrastructure story when you line up the latest figures. Revenue in H1 2027 is modestly higher than H1 2026, which keeps the basic demand picture intact. The bigger shift sits in earnings power. Net income excluding extras is now more than double the prior period and basic EPS has moved in the same direction. A trailing margin near 7% compared with roughly 0.6% previously points to earnings quality healing, which fits a defensive, brand led bathroom fixtures business.
Share Weakness And Risks Temper The Optimism
Shareholders have still taken some pain. The stock is down about 6% over three months and roughly 7% over ninety days even after a recent bounce. That disconnect indicates some investors still worry about cyclicality in construction linked demand or future cost pressure. At the same time, a very large step up in profitability and a higher revenue base suggest immediate operational risks look less acute than past sentiment implied. The recently announced buyback of up to 9.5 million shares also points to management confidence in TOTO’s balance sheet strength.
After a share price that has swung around recent earnings and a dividend that is not well covered by free cash flows, it is worth asking if these visible weak spots are masking deeper issues in TOTO’s risk profile. Review the full risk analysis for TOTO which shows 2 important warning signsHunt Balance Sheets Before Crowds
TOTO showed that investor sentiment and reported results do not always match in the short term. The real opportunity is finding stocks that could be low debt before the market reassesses them.
- Company 1 - 35% below our estimate - uses AI to refine hiring, automate screening and match local services for employers and consumers.
- Company 2 - 18% below our estimate - expands a maintenance sales force to secure long-term elevator service contracts as installed units age.
- Company 3 - 45% below our estimate - focuses on AI-led cybersecurity tools so subscription security platforms deepen customer adoption despite higher operating costs.
Those are three of them. See every one of the 22 solid balance sheet companies →
Have feedback on this article? Concerned about the content? Get in touch with us directly. Alternatively, email editorial-team@simplywallst.com