


NetLink NBN Trust (SGX:CJLU) Reports Lower Half Year Profit, Is Its Premium Valuation Justified?
NetLink NBN Trust (SGX:CJLU) just released half year figures to 30 September 2026, reporting sales of S$202.61 million and net income of S$40.48 million, both lower than the prior period.
NetLink NBN Trust’s recent results come after a softer period for the units, with the share price down 7.43% over 3 months and 2.09% over 30 days. However, the trust has delivered a 3-year total shareholder return of 33.09%, which suggests long term holders have still been compensated even as near term momentum has faded.
Compare NetLink NBN Trust's recent margin pressure with the fibre-like stability in other income-focused plays by scanning our hand-picked 221 dividend fortresses.
NetLink NBN Trust now trades at a discount to both analyst targets and estimated fair value, while its margins have come under pressure. Is that gap a genuine opportunity or a warning that the market is pricing in correctly?
Preferred P/E of 45.4x: Is it justified?
NetLink NBN Trust changes hands at a P/E of 45.4x, which is rich relative to both its own earnings profile and what investors are paying for similar telecom trusts. The last close at S$0.94 sits against analyst targets of S$1.05 and an internal fair value estimate based on future cash flows of S$1.32. This raises the question of whether this earnings multiple reflects something durable or simply a willingness to pay up for perceived stability.
The P/E ratio compares what the market is paying for each dollar of current earnings. For a regulated fibre network owner like NetLink NBN Trust, this gauge is often used as a shorthand for how much investors are willing to pay for its income stream and growth prospects, especially when revenue and profit forecasts are relatively modest.
In this case, the 45.4x figure sits well above the Asian Telecom industry average of 14x, which represents a strong premium. It also exceeds an estimated fair P/E of 21.3x, suggesting the market valuation is materially higher than a level the numbers could move toward if sentiment cools. That combination points to investors assigning a high price to the trust's cash flows despite earnings being forecast to grow 3.74% per year and returns on equity expected to remain low.
Explore the SWS fair ratio for NetLink NBN Trust.
Result: Price-to-earnings of 45.4x (OVERVALUED)
Still, the higher P/E could unravel quickly if NetLink NBN Trust faces sharper margin compression, or if regulators tighten returns on its fibre network assets.
Find out about the key risks to this NetLink NBN Trust narrative.
Another view on NetLink NBN Trust’s value
The high P/E hints at a stretched price tag, yet NetLink NBN Trust screens very differently when the in-house SWS DCF model is used. From that perspective, the units trade around S$0.94 against an estimated future cash flow value of S$1.32, which suggests a discount rather than a premium. That difference raises a simple question for you as an investor: which signal do you rely on more, earnings today or projected cash flows over time?
Look into how the SWS DCF model arrives at its fair value.
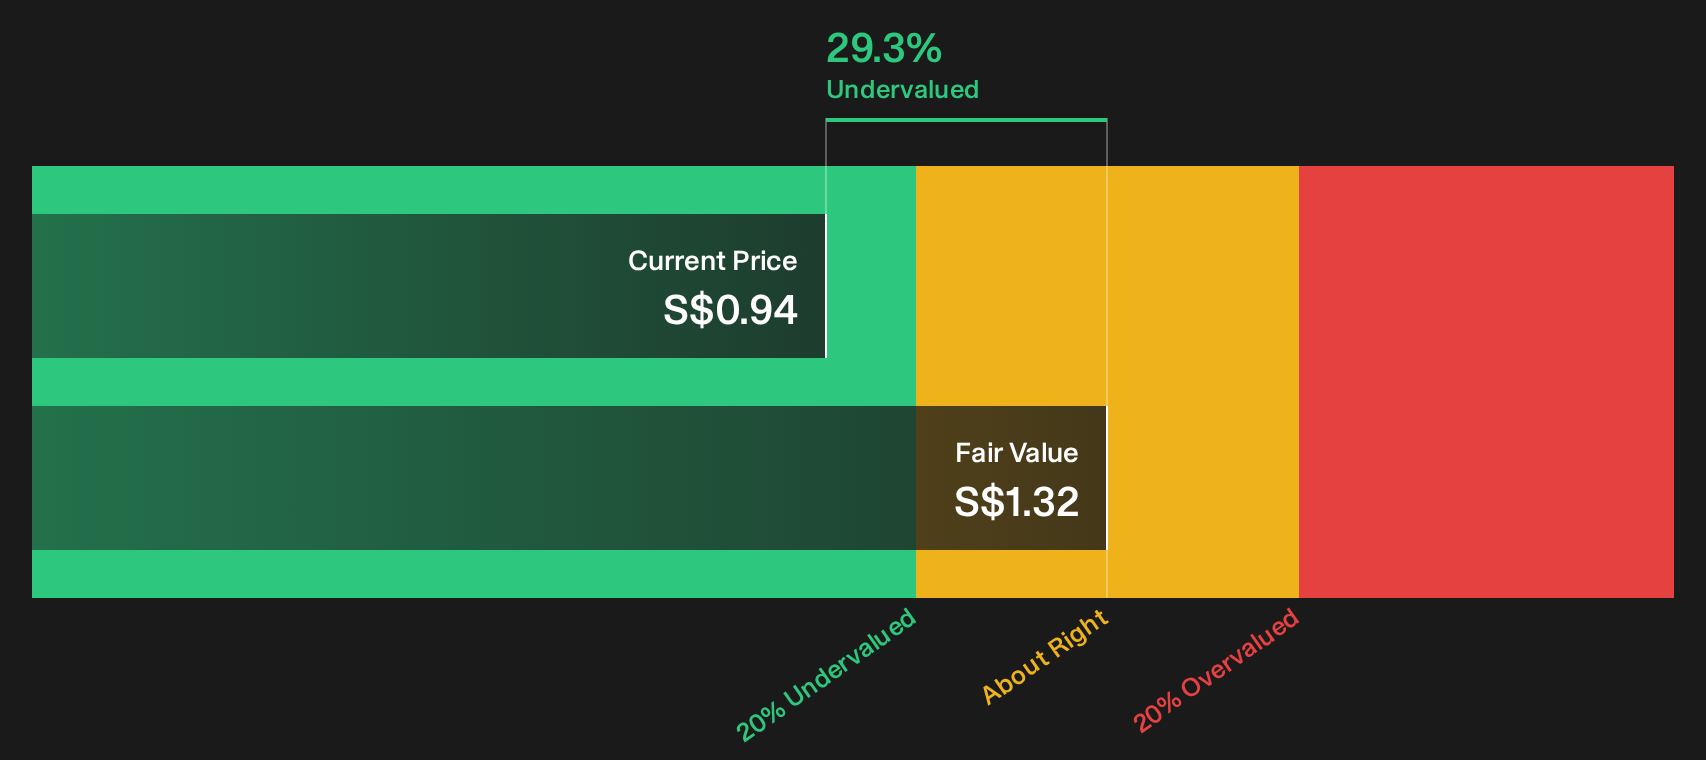
Simply Wall St performs a discounted cash flow (DCF) on every stock in the world every day (check out NetLink NBN Trust for example). We show the entire calculation in full. You can track the result in your watchlist or portfolio and be alerted when this changes, or use our stock screener to discover 204 high quality undervalued stocks. If you save a screener we even alert you when new companies match - so you never miss a potential opportunity.
Next Steps
If this mix of rich multiples and cash flow support leaves you torn, act while the data is fresh and test the thesis yourself using our breakdown of 2 key rewards and 1 important warning sign
Looking for more NetLink NBN Trust investment ideas?
Fresh ideas rarely land in your lap. Put the current NetLink NBN Trust setup in context by lining it up against other opportunities before the next move takes shape.
- Target quality at a sensible price by reviewing our hand picked 204 high quality undervalued stocks that pair strong fundamentals with restrained expectations.
- Prioritise resilience by working through a 218 resilient stocks with low risk scores that filters for businesses with more robust risk profiles.
- Hunt for tomorrow's quiet overachievers by scanning a 614 high quality undiscovered gems that screens for strong fundamentals before they are widely followed.
Have feedback on this article? Concerned about the content? Get in touch with us directly. Alternatively, email editorial-team@simplywallst.com