


OMV (WBAG:OMV) Earnings Put Valuation Back In Focus
OMV (WBAG:OMV) has released its third quarter 2026 results, reporting higher sales, revenue, net income and earnings per share for both the quarter and the nine-month period compared with the prior year.
Investors have responded quickly to OMV's earnings release, with the share price up 3.04% in the last session and showing a 30 day share price return of 8.01%. The 1 year total shareholder return of 72.42% and 3 year total shareholder return of 153.00% point to strong momentum that has been building rather than appearing overnight.
Scan how OMV compares with other energy players showing strong price action and robust fundamentals by reviewing our hand picked 199 high quality undervalued stocks.
The question now is whether OMV's sharp rerating reflects investors finally catching up with the earnings power just reported, or a sentiment surge that has run ahead of what the business is worth.
Most Popular Narrative: 12.9% Overvalued
OMV last closed at €76.15, while the most followed valuation narrative anchors fair value at €67.46. The recent share price strength sits above that framework and leans on execution delivering more than the base case.
Progress on European and regional gas security projects, with Neptun Deep in the Black Sea moving toward first gas in 2027 at a planned plateau of 8 bcm a year and Wittau in Austria aiming to roughly double domestic gas production to about 11 TWh a year from winter 2026 and 2027, underpins expectations for a higher share of earnings and cash flow from gas once these volumes are in place.
See why 37 investors see OMV as 13% overvalued.
Result: Fair Value of €67.46 (OVERVALUED)
Still, OMV’s story can change quickly if cost pressures persist, or if tighter fuel pricing rules bite harder into segment margins than analysts currently assume.
Find out about the key risks to this OMV narrative.
Another View: What OMV's P/E Is Really Telling You
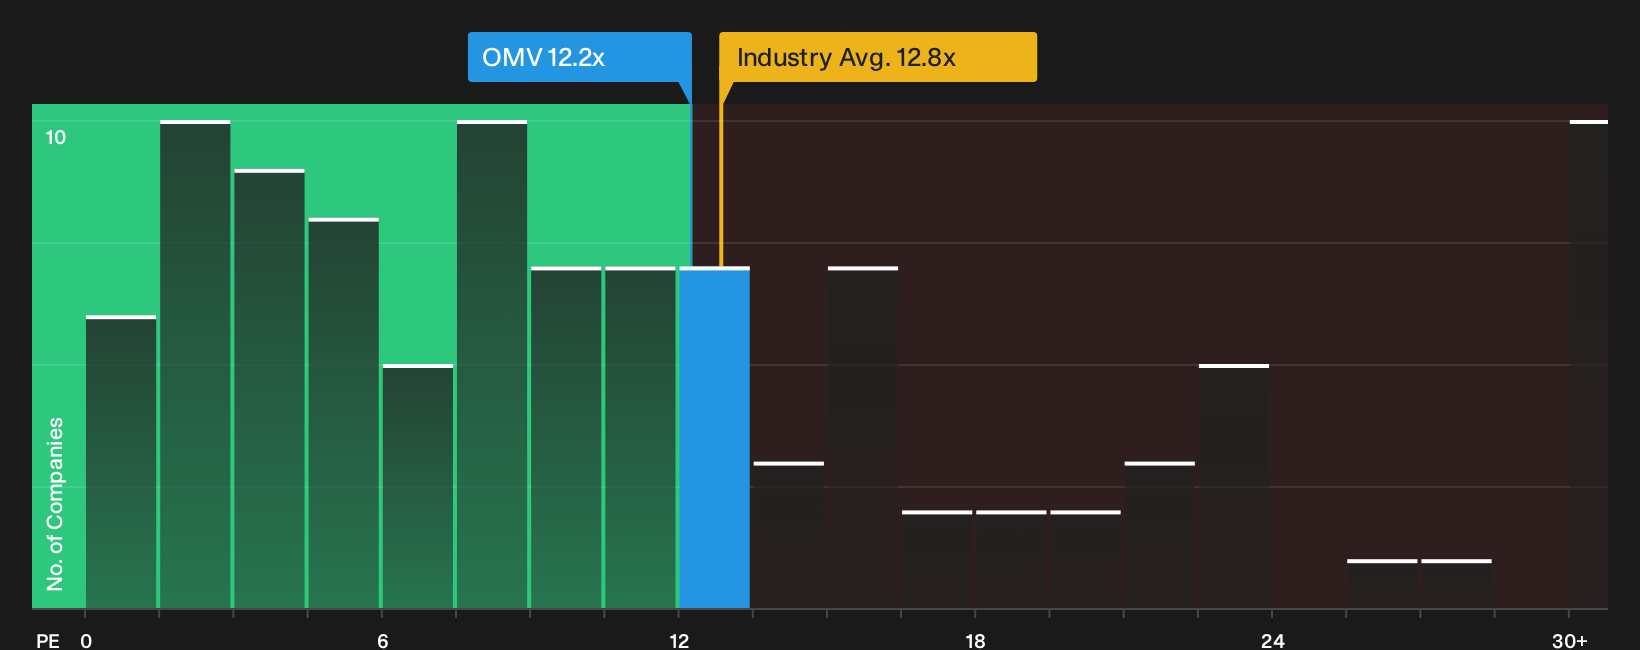
The first narrative frames OMV as roughly 12.9% overvalued compared with a €67.46 fair value, yet the current P/E of 12.2x sends a different signal. That ratio is slightly lower than the wider European Oil and Gas sector on 12.8x, and well below the 22.4x fair ratio suggested by regression analysis.
Against closer peers on 8.3x, OMV screens more expensive. This points to less of a bargain and more of a quality premium that investors need to judge carefully. The gap between the present 12.2x and the higher 22.4x fair ratio frames a wide range of possible outcomes, so which reference point do you trust when pricing risk and opportunity?
See what the numbers say about this price — find out in our valuation breakdown.
Next Steps
Strong opinions are forming around OMV, yet markets move fast and the real edge comes from testing the numbers yourself while sentiment is still fresh. To weigh the upside against the red flags and pressure points on your own terms, walk through the 3 key rewards and 1 important warning sign.
Looking for more investment ideas beyond OMV?
Use OMV as a reference point, then broaden your watchlist by scanning other opportunities that fit different goals, risk levels and income needs across the market.
- Target resilient dividend income by reviewing companies screened as 223 dividend fortresses that may suit investors who want cash returns alongside potential capital gains.
- Hunt for mispriced quality by using the screener of 612 high quality undiscovered gems before others adjust their expectations and reassess those fundamentals.
- Dial down portfolio volatility by focusing on a 218 resilient stocks with low risk scores that can help anchor returns when markets become more volatile.
Have feedback on this article? Concerned about the content? Get in touch with us directly. Alternatively, email editorial-team@simplywallst.com