


Alliant Energy (LNT) Rallies On Earnings And DOE Loan As Fair Value Debate Builds
Alliant Energy (LNT) just packed several catalysts into two days. Investors are weighing stronger third quarter earnings, tighter 2026 guidance, fresh 2027 targets, a higher 2027 dividend goal, and a new federal loan package.
Recent moves in Alliant Energy’s share price suggest investors are starting to price in these catalysts, with a 30-day share price return of 11.38% and a year-to-date gain of 9.24%, while the 5-year total shareholder return of 49.56% reflects long-run compounding over that period.
Scan how Alliant Energy’s catalysts compare with other regulated utilities preparing for heavy grid and energy transition spending by reviewing the hand-picked 41 power grid technology and infrastructure stocks in the same space.
For Alliant Energy, a quick 30 day jump in the share price can look like a vote of confidence in the utility’s earnings power or a burst of enthusiasm that got ahead of itself. The valuation now needs to do the explaining.
Most Popular Narrative: 6% Undervalued
Against a last close of $71.65, the most followed narrative pegs Alliant Energy’s fair value at $76.29. This frames the recent rally as still short of that reference point and puts its data center buildout at the center of the thesis.
The accelerating construction and onboarding of large-scale data centers under five executed electric service agreements totaling about 3.4 GW of contracted demand, plus a further 2 to 4 GW pipeline of large-load opportunities, points to a multi year step up in Alliant Energy’s electricity sales and regulated revenue base as these projects ramp through 2031.
See why 5 investors see Alliant Energy as 6% undervalued.
Result: Fair Value of $76.29 (UNDERVALUED)
Still, Alliant Energy’s heavy reliance on a 3.4 GW contracted data center book and a further 2 to 4 GW pipeline could become a drag if projects stall.
Find out about the key risks to this Alliant Energy narrative.
Another View: Alliant Energy Through A Cash Flow Lens
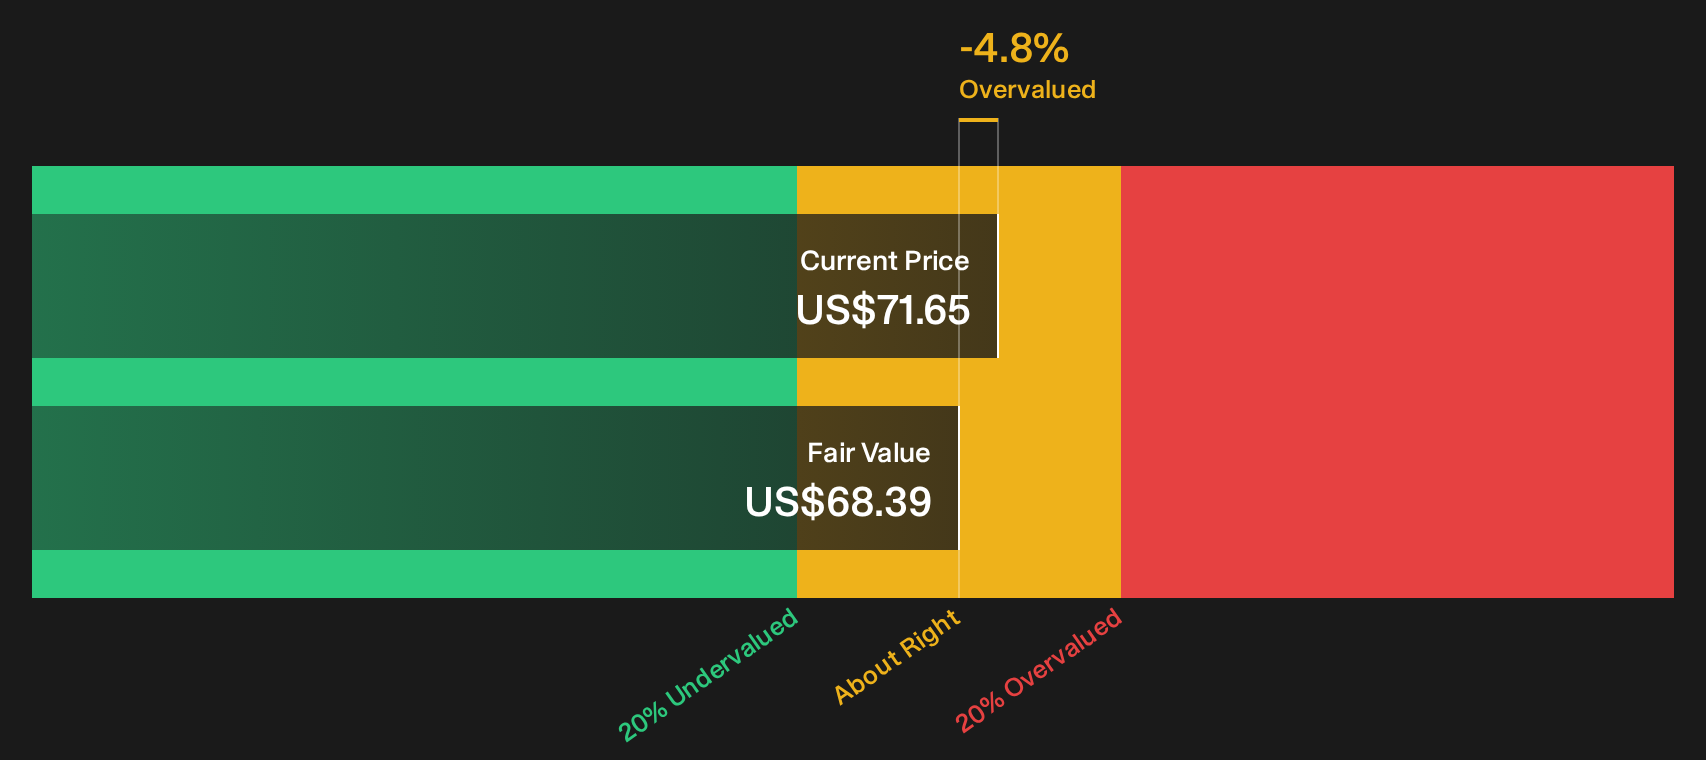
A different yardstick tells a cooler story. Alliant Energy trades at $71.65, while the SWS DCF model points to a future cash flow value of $68.39. That implies the shares are pricing in slightly richer expectations than this framework supports, which raises a simple question: How much optimism are you comfortable paying for?
To pressure test that gap against your own assumptions, start by unpacking how long term cash flows, discount rates, and terminal values feed into our DCF model. Then compare them with your view of Alliant Energy’s data center plans and capital spend, and see where you agree or disagree with Look into how the SWS DCF model arrives at its fair value.
Simply Wall St performs a discounted cash flow (DCF) on every stock in the world every day (check out Alliant Energy for example). We show the entire calculation in full. You can track the result in your watchlist or portfolio and be alerted when this changes, or use our stock screener to discover 30 high quality undervalued stocks. If you save a screener we even alert you when new companies match - so you never miss a potential opportunity.
Next Steps
Mixed signals on Alliant Energy’s valuation and cash flow story can feel confusing, so move quickly, review the underlying data, and weigh both upside and downside using the 2 key rewards and 2 important warning signs
Looking for more investment ideas beyond Alliant Energy?
If Alliant Energy has your attention, do not stop there. Broaden your opportunity set and pressure test your next move using curated stock ideas built from hard data.
- Target resilience first and hunt for companies with strong balance sheets and solid fundamentals through a focused list of solid balance sheet and fundamentals (24 results).
- Pursue value with intent and scan a curated 30 high quality undervalued stocks that blend quality businesses with prices that may not fully reflect their fundamentals.
- Prioritise sleep-at-night potential and review a 29 resilient stocks with low risk scores designed to spotlight businesses with lower risk scores based on their financial profile.
Have feedback on this article? Concerned about the content? Get in touch with us directly. Alternatively, email editorial-team@simplywallst.com