


OBIC Business Consultants (TSE:4733) Could Be 28% Above Fair Value After Half Year Earnings
OBIC Business Consultants (TSE:4733) just released half year earnings to September 30, 2026, reporting sales of ¥28,666.7 million and net income of ¥10,135.05 million, with basic EPS of ¥134.82.
The latest half year report lands after a strong run in the shares, with a 23.8% 1 month share price return and a 24.0% 3 month share price return to ¥9,923. Over the longer haul, total shareholder returns of 14.3% over 1 year and 91.3% over 5 years indicate momentum that has been building rather than fading.
Scan past OBIC Business Consultants and see how it stacks up against other software players with the strongest recent momentum and fundamentals using our hand picked 71 high quality undiscovered gems.
OBIC Business Consultants now combines strong reported earnings with a sharp share price jump. The real test is whether that quality is already fully reflected in the current valuation.
Price-to-Earnings of 37.3x: Is it justified?
On the latest figures, OBIC Business Consultants trades on a P/E of 37.3x, which sits above both its peer group and the wider JP Software sector, even after the recent move up to ¥9,923.
The P/E multiple compares what investors are willing to pay today for each unit of current earnings. For a software-focused business like OBIC Business Consultants, this ratio often reflects expectations around profit durability, recurring revenue, and how long earnings growth can be maintained.
Here, the market is valuing the earnings stream at a much richer level than the JP Software industry average P/E of 17.8x, and even above the peer average of 35.1x. That suggests investors are pricing in stronger or more dependable profitability than the typical software stock. It also sits well above the estimated fair P/E of 24.5x. This points to a valuation level the market could move towards if expectations cool or forecasts are revised.
Explore the SWS fair ratio for OBIC Business Consultants.
Result: Price-to-Earnings of 37.3x (OVERVALUED)
Still, the OBIC Business Consultants story could change quickly if software spending slows or if rich expectations meet weaker-than-anticipated contract wins.
Find out about the key risks to this OBIC Business Consultants narrative.
Another View On OBIC Business Consultants’ Value
The P/E ratio suggests OBIC Business Consultants may be expensive, and the SWS DCF model points in the same direction. At ¥9,923 the share price sits above an estimated future cash flow value of ¥7,769.87, which implies limited room for error if forecasts disappoint.
Look into how the SWS DCF model arrives at its fair value.
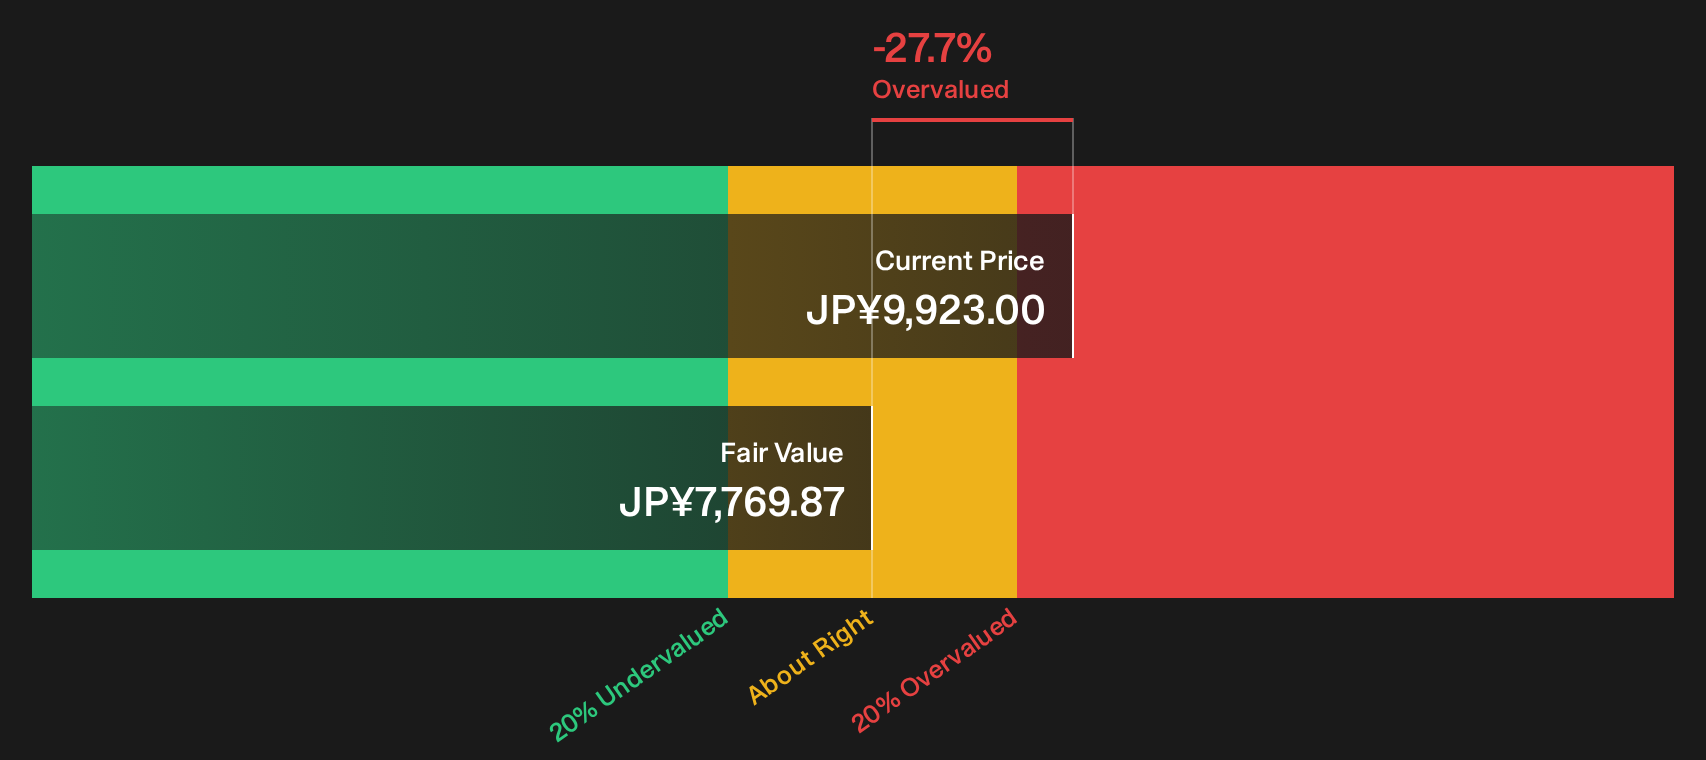
Simply Wall St performs a discounted cash flow (DCF) on every stock in the world every day (check out OBIC Business Consultants for example). We show the entire calculation in full. You can track the result in your watchlist or portfolio and be alerted when this changes, or use our stock screener to discover 15 high quality undervalued stocks. If you save a screener we even alert you when new companies match - so you never miss a potential opportunity.
Next Steps
Big valuation debates like this rarely stay settled for long, so it makes sense to look at the numbers yourself and stress test your thesis. To see why some investors are still optimistic about OBIC Business Consultants despite the rich multiples, take a closer look at the 2 key rewards.
Looking for more investment ideas beyond OBIC Business Consultants?
If OBIC Business Consultants has sharpened your focus on quality, do not stop there. Use targeted screeners to uncover other potential opportunities that fit your approach.
- Target resilient balance sheets and steady fundamentals with a curated list of solid balance sheet and fundamentals (22 results) that keeps financial strength front and center.
- Hunt for potential value opportunities by scanning the 15 high quality undervalued stocks that filters for quality businesses trading below their assessed worth.
- Prioritize stability and lower volatility by focusing on a 24 resilient stocks with low risk scores designed to spotlight companies with more robust risk profiles.
Have feedback on this article? Concerned about the content? Get in touch with us directly. Alternatively, email editorial-team@simplywallst.com