


Ryerson Holding (RYZ) Beat Expectations, Has The Valuation Run Too Far?
Ryerson Holding (RYZ) just paired its strongest quarter of 2026 with a new quarterly dividend and fresh earnings guidance, giving investors several concrete data points to reassess the stock.
Recent news has landed on an already strong run for Ryerson Holding, with a 30 day share price return of 32.22% and a year to date share price gain of 20.92% feeding into a 1 year total shareholder return of 45.34%. This signals momentum building around the earnings beat, new dividend and guidance update.
Scan how Ryerson Holding’s momentum and fresh dividend stack up against other metal processors by running the hand picked list of solid balance sheet and fundamentals (25 results) alongside this earnings story.
Ryerson Holding now trades above the average analyst target, yet screens at a steep intrinsic discount. Is the market flashing healthy caution or mispricing a material reset in the business story?
Price-to-Earnings of 114.2x: Is it justified?
On simple valuation math, Ryerson Holding looks expensive. A $31.15 share price lines up with a P/E of 114.2x, while the broader US Metals and Mining group sits at 17.2x and close peers at 40.1x.
The P/E ratio compares what investors pay today for each dollar of reported earnings. For a metals processor like Ryerson Holding, that figure often reflects how volatile profits have been, how much earnings are being influenced by one off items, and how confident the market feels about the durability of the latest quarter.
Here, the context matters. Management has only recently steered the business back to profitability, earnings have declined by 63.4% per year over the past 5 years, and the most recent 12 months include a $21.3m one off gain. A P/E of 114.2x against an industry level of 17.2x and a peer average of 40.1x signals that the market is paying a very rich multiple for what is currently low return on equity of 1.2% and earnings that are hard to treat as clean run rate.
See what the numbers say about this price — find out in our valuation breakdown.
Result: Price-to-Earnings of 114.2x (OVERVALUED)
Still, the narrative around Ryerson Holding can quickly shift if earnings remain thin relative to its US$1.60b market cap, or if any one off gains fade from view.
Find out about the key risks to this Ryerson Holding narrative.
Another View on Ryerson Holding’s Value
On earnings, Ryerson Holding screens expensive. On cash flows, the story flips. Our DCF model points to a fair value of $100.85 per share, which is well above the current $31.15 price and implies the stock trades at a steep discount to that cash flow view.
If the P/E suggests caution while the SWS DCF model points to a wide gap, the question becomes which signal you trust more when earnings are thin and one off gains matter this much.
Look into how the SWS DCF model arrives at its fair value.
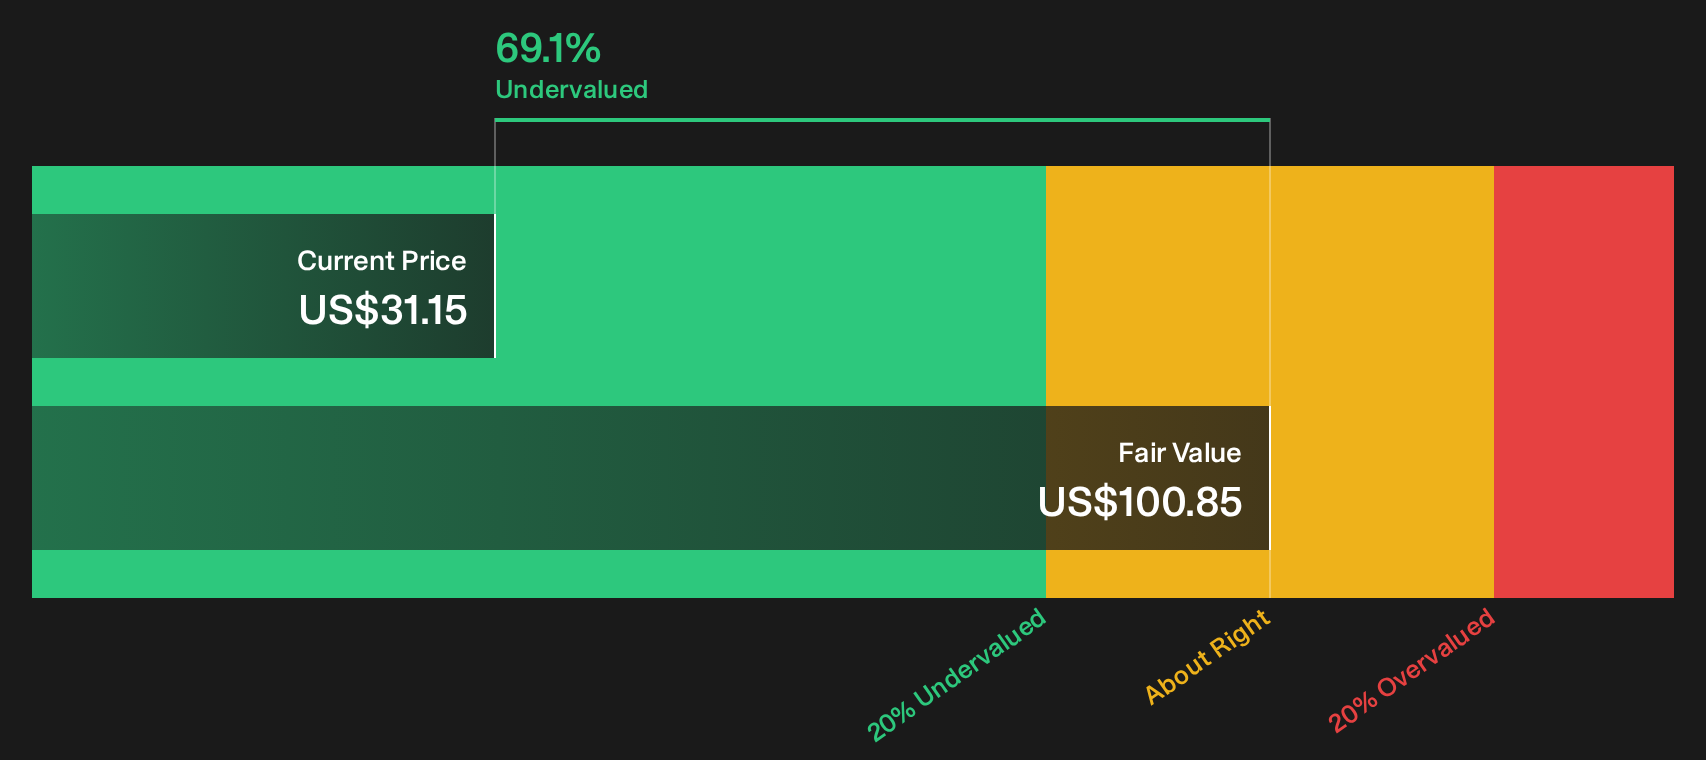
Simply Wall St performs a discounted cash flow (DCF) on every stock in the world every day (check out Ryerson Holding for example). We show the entire calculation in full. You can track the result in your watchlist or portfolio and be alerted when this changes, or use our stock screener to discover 29 high quality undervalued stocks. If you save a screener we even alert you when new companies match - so you never miss a potential opportunity.
Next Steps
Conflicted by the mix of optimism and concern running through this Ryerson Holding story. Take a closer look at the full set of trade offs so you can weigh the 2 key rewards and 5 important warning signs
Looking for more investment ideas beyond Ryerson Holding?
If this Ryerson Holding setup has you thinking harder about where to put fresh capital next, do not stop with a single ticker.
- Target income resilience by scanning companies that aim to deliver reliable cash payouts and balance strength through the 5 dividend fortresses.
- Hunt for quality at a discount by reviewing the 29 high quality undervalued stocks that combine solid fundamentals with pricing that still looks conservative.
- Upgrade your watchlist with under the radar opportunities by checking the 18 high quality undiscovered gems before other investors start paying attention.
Have feedback on this article? Concerned about the content? Get in touch with us directly. Alternatively, email editorial-team@simplywallst.com